
This is a summary of the survey’s results, The State of Design — Swedish Edition 2022.
The data for this report was collected from July through September 2022, with 864 responses. (Hey, we got a record 🚀)
Executive Summary
As designers and leaders, we live and work in a complex and volatile world. Unfortunately, the climate and earth are not feeling well at all. There is a war in Ukraine, and COVID-19 is still here. There is a global economic downturn, and many large companies are dismissing numerous people and creating personal tragedies.
From the troubles and hardship, people stand up, rise and search for new opportunities. As a result, we, as designers and leaders, can positively impact our families, friends, colleagues, and many other human lives.
This report is a tiny part of making this happen. Our purpose is to support designers and leaders to amplify the impact of Design and share experiences & knowledge.
How might we, as designers and leaders, support our family, friends, colleagues, and humans in creating something that makes a positive impact?
A few pics from this year’s insights
If you are looking for more data and insights, there is the Premium and Premium+ plan. In these plans, you can find for example find more and more in-depth insights and data about leadership, ownership, process, and responsibility, investment trends and recruitment, organization, working overtime, demography and richer salary information
Work situation for leaders and designers
- People still love to solve problems, find and understand people’s needs and meet customers.
- People feel less satisfied at work because of poor leadership, politics & bureaucracy, difficult colleagues or dysfunctional team, and lack of learning and focus. It would be interesting to continue to learn more about what makes poor leadership for the coming years.
- When we asked people, What is important for you right now? we were surprised that Accessibility is now number 1, up from 21st place last year. It pushed Design Thinking down from the top in the previous two years. Last year we had Inclusive Design at 3rd place, which might be similar. It might be that new rules and regulations are on the way about accessibility. Design Systems and Design Ops are still interesting topics, indicating that Design functions exist in larger organisations.
Eduction and competence
- About 64% of main design schools are rated between 7-10 (good to excellent).
- There are some interesting numbers when people rate their school regarding how much it has helped them in their daily work.
Salary and benefits
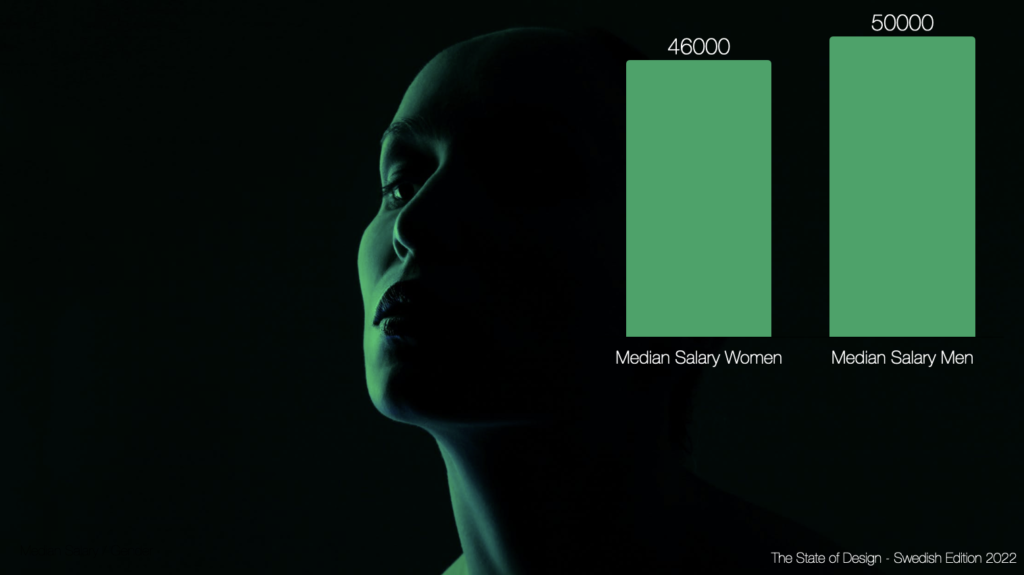
- The median salary for all responses increased since last year (this is probably because more design leaders and managers have answered this year).
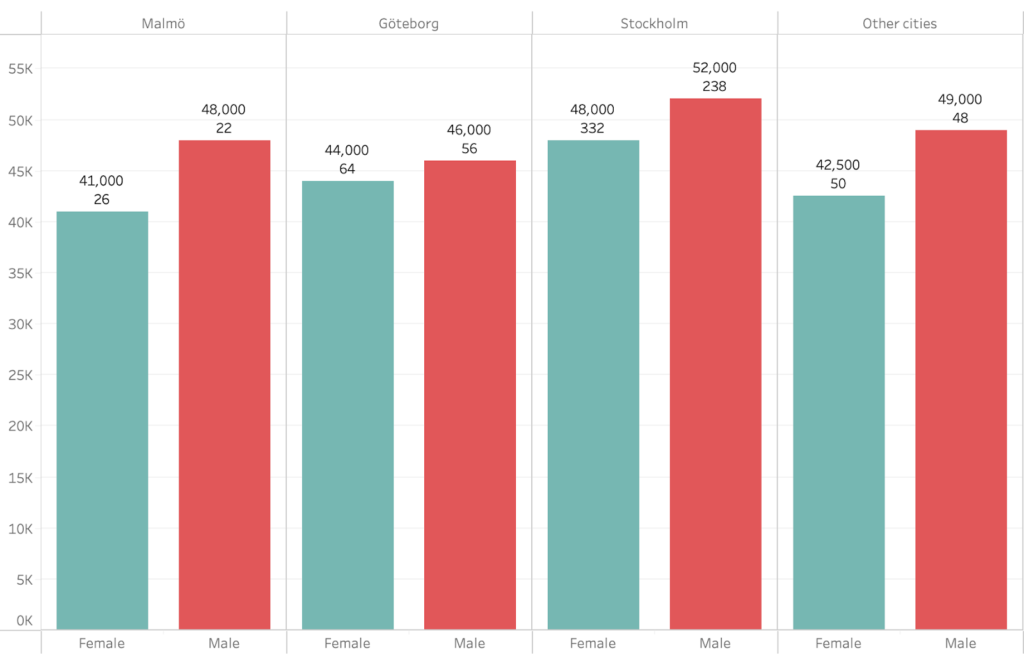
- There is still a gap between salaries for men and women, especially in Malmö. Let’s make 2023 the year when this is not an issue, OK?
- There is still a significant salary gap for women working in Stockholm compared to other cities.
- The prices for design consultants are slightly higher than last year.
Demography and who answered this year
- More Senior Designers and Head of, VP and Directors of… have answered this year compared to last year. Hopefully, this is because there are more tactical and strategic roles within the design area, but it might also be that just more design leaders have decided to answer this year. We can’t be certain.
- More women, 56% answered this year than men, 43%.
- The largest group who answered the survey were between 26 and 45, unchanged from previous years.
- Most people using the title UX Designer, Service Designer, UX Lead and Product Designer answered the survey.
- There is still an extensive list of different roles and titles, causing much confusion.
- 88% of the respondents work in Sweden’s three largest cities, even though there is a spread in many other smaller towns.
Important note before we begin. Dean Abbott once wrote, “No data is clean, but most is useful.”. As with all data, analytics, insights, and summaries. Please take it gently, as this report is only parts of the truth. See this information as inspriation and a start of a discussion. In the data which we have collected we can see patterns and indications of someting, but it does not need to be true. And if you spot something that looks strange or wrong, please get in touch, and we will look into it — The working team of State of Design.
Navigation
- Work situation for leaders and designers
- Design in organisation (can be found in the paid premium plans)
- Eduction and competence
- Design Leadership (can be found in the paid premium plans)
- Salary and benefits
Work situation for leaders and designers
What is important for you right now?
We introduced this question three years ago to understand what trends and topics influence and are influential for designers and leaders.
We were surprised that Design Thinking was the top-ranked area in the last two years. This year, Accessibility is now at the top, a considerable jump from 21st place last year. We are not sure why Accessibility has increased so much in popularity this year.
Design Systems and Design Ops are still interesting topics, probably because of more Design in the enterprise and the need to operationalise design in the delivery organisation.
The trend from the last few years that more designers work in product- and service companies and governments continues. This likely means that more companies and government agencies have strengthened their design capability. This shift is also visible because Design Leadership and Design Coaching is ranked higher.

Other topics that was mentioned was: Communication design, Mission-driven innovation, UX and CRO, Product discovery, Critical design, Conceptual design, Non-capitalist design, Visions, UX Metrics Strategy, CX, Futures design, speculative design, Aesthetics, Ornamentation, Beauty, Product thinking, Continuous discovery, Framsyn, Framtidsscenarios, Motion Design
Accessibility maturity level
Accessibility is an important topic this year. This is probably because new rules and regulations are on the way. Here are how companies today work with the topic.

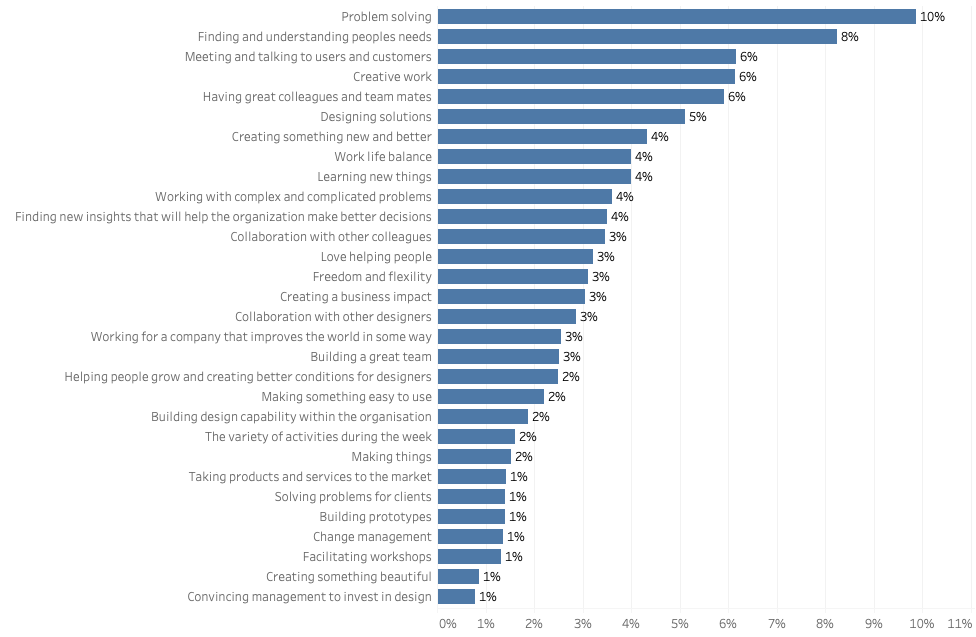
What do you love?
This year, we changed the response alternatives from free text to pre-set answers. This is because we saw trends in what people wrote, and with that information, we can make more statistics and graphs instead of only a word cloud.
The answer categories have mostly stayed the same. It’s still:
- Problem-solving
- Understanding people’s needs,
- Meeting users and customers
- Being creative
- Collaborating with great people
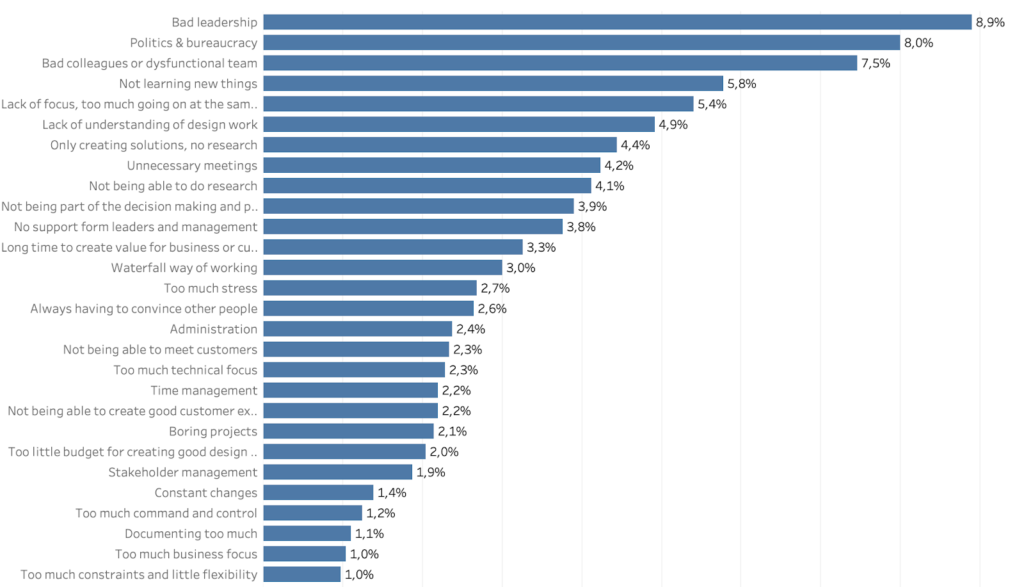
So, what is less fun?
Most designers struggle with the same things. The top five things people struggle with:
- Bad leadership
- Politics & bureaucracy
- Bad colleagues or a dysfunctional team
- Not learning new things
- Lack of focus
Our take: Bad leadership is a “winner” of things people think is less fun. What can you improve in your team and organisation to improve this for the next year? We could ask more questions about what makes poor leadership or have a meetup to dive into this topic.
Education and competence
Competence development is a new area for this year. Here are the key points from this area:
- 32% don’t know how much they can spend on competence development, 6% have no resources.
- Freelances spend most on competence development.
- In larger companies, more people don’t know what they have for their development opportunities.
- In immature design organisations, more people have no budget for competence development.
- The more design ownership people feel, the larger budget for development.
- There is no difference depending on where you are in your organisation.
- Organisations that keep design investment at the same level or increase their design investment spend considerably more on competence.
- Older people have better insight into their competence budget and go towards higher spending than junior designers.
- People in Stockholm seem to have a higher budget than the rest of the country, and people in Malmö seem to have a better understanding of what kind of budget they have.
- Men appear to have a better understanding of their budget, compared to women, men also seem to have a tendency for a higher spending than woman.
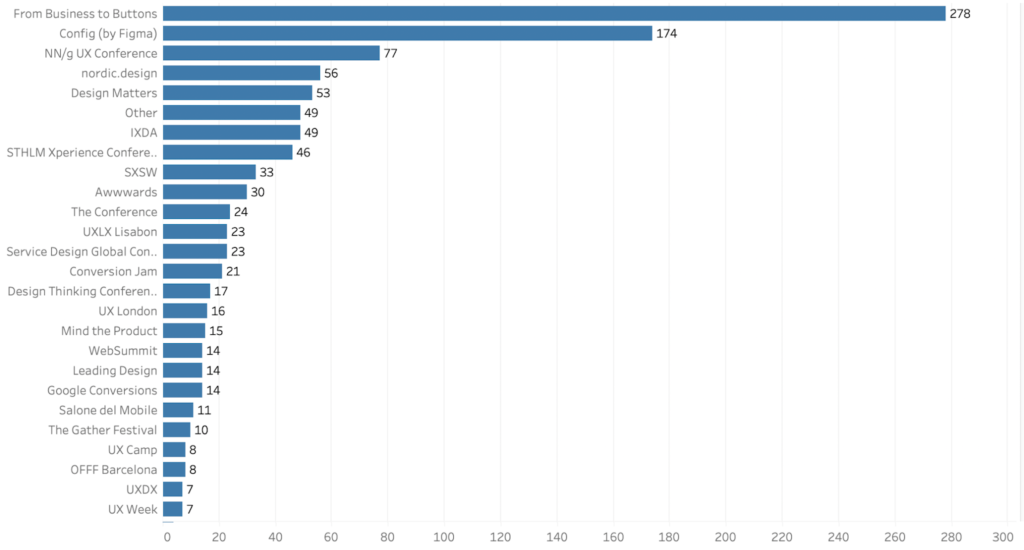
- Most popular design conferences are From Business to Buttons, Config by Figma (new) and NN/g UX Conference.
Our take on competence development: Competence and learning is key for progress, motivation and creating a significant impact on your customers, users, and business. The budget for competence is often forgotten in the discussions about perks and salary. Try to bring this up when you are trying to get hired, but also in your discussion with your manager or colleagues. Hopefully, these new questions and insights can help you in your future conversations.
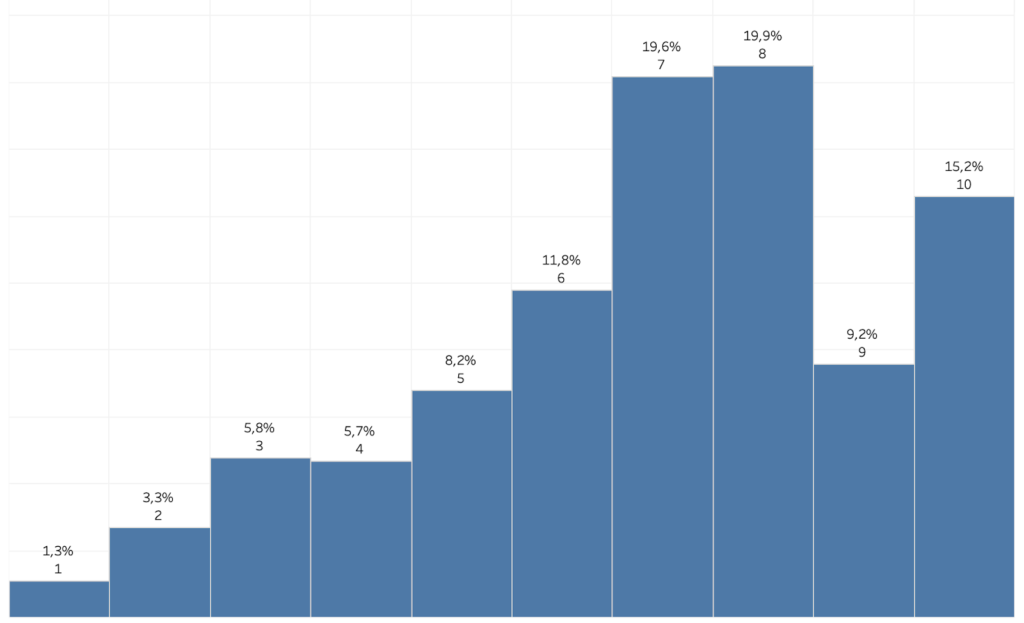
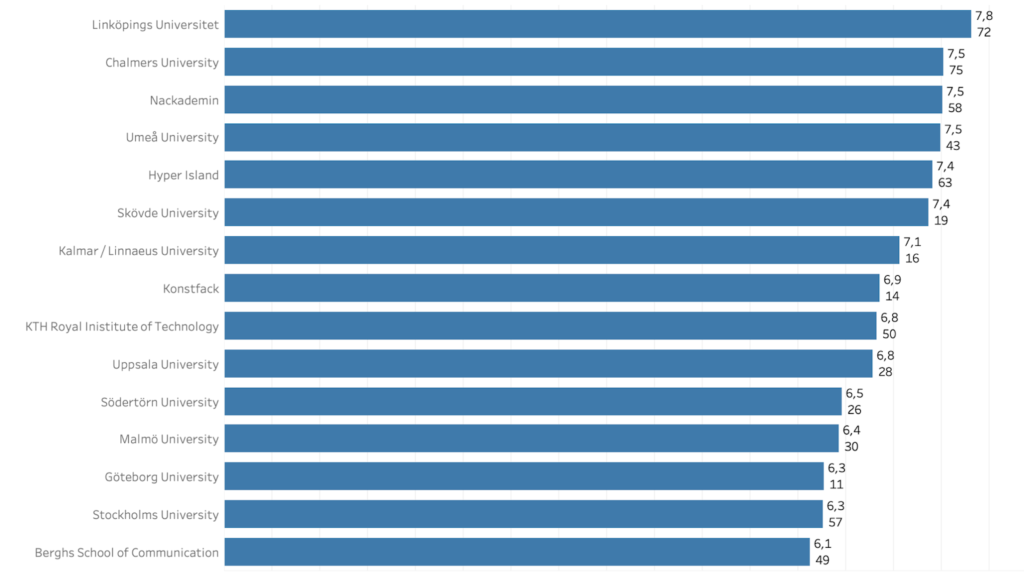
How much would you rate that your primary school has helped you in your work?
About 64% of schools are rated between 7-10. The other graph below represents how many answered, Which was your primary design school? and How much would you rate that above school have helped you in your work? For example, Linköpings University had 72 answers, and the average rating was 7.8.
Our take: This is great news and insights for design schools. It is also interesting to get data on how people rate their different design schools, and how they can be compared when it comes to helping them in their current work.
Which design conferences are most popular?
So, where do designers go to learn new things, network and have fun? From Business to Buttons Config (by Figma), NN/g UX Conference, nordic.design and Design Matters and many others. New and in 2nd place this year is Config (by Figma) which wasn’t on the list last year.
Salary and benefits
Summary
Disclaimer. Be careful to draw concrete conclusions, use this data as a starting point and remember, salary is just one part of the job.
For those who do not live in Sweden, 1 Swedish Krona (SEK) equals about 0,097 U.S. dollars or 0,092 Euros. In Sweden, salary is often written per month and before income tax (the income tax in Sweden is roughly around 23–36% depending on your salary level, see more about our tax system in Sweden). Therefore, the salaries below do not include perks and benefits. The median salary in Sweden 2021 was 33,200 SEK (3.227 USD) according to SCB.
Description: The numbers on top of the columns in the graph are the median salary, and how many who answered the question.
849 answered the question about salary this year.
The question about monthly salary has a fixed range of salary from 0 to 200.000. 275 answered the questions about hourly price rate for consultants.
The hourly price rate was fixed from 100 to 3.500 SEK, excluding tax.
| Who | Responses | Median salary 2022 | 2021 | Change |
| All | 849 | 48.000 | 47.000 | +2.1% |
| Woman | 473 | 46.000 | 45.000 | +2.2% |
| Men | 364 | 50.000 | 48.000 | +4.1% |
Median salary per gender
Median salary distribution
Legend
Male: Red
Female: Blue/green
Salary per region and city
Bigger city, bigger pay cheque, well, not really. This has been the case in the former years, but not this year. Here are the median salaries per city and gender. We grouped other cities together as there were too few data points. There is still a big (7.000:-) difference for women who work in Stockholm and Malmö.
We also included data about cost of living from an external site (Numbeo), to understand the differences within Sweden but also with the US.
| The Malmö region | The Göteborg region | The Stockholm region | Other cities | |
| Female | 41.000 (+5.1%) | 44.000 (+10%) | 48.000 (+2.1%) | 42.500 (+1.2%)(1) |
| Male | 48.000 (+2.1%) | 46.000 (+2.2%) | 52.000 (+6.1%) | 49.000 (+8.9%) |
| Consumer Prices Including Rent compared to Stockholm (3) | -21% | -18% | 0% | -20.48%(2) |
- Numbers in parentheses are the change from last year.
- Used data from Linköping.
- All data from Numbeo.
Cost of living in Sweden is 18.61% lower than in the United States (aggregate data for all cities, rent is not considered). Rent in Sweden is, on average,53.92% lower than in the United States. Numbeo.
Median hourly rate as consultant or working in an agency
Consultants or freelancers often have an hourly rate (excluding tax means that the price does not include VAT). There is still a wide range in the price, from 100(!) to 2500(!) with a median of 1,100 excl. tax, which is up 100:- from last year. The largest group is between 900:- and 1200:- which is the same as last year. We can see that some roles have higher rates than others and that tactical and strategic roles pays higher.
Our take: The price seems to go up a bit, but there is still a price point at 1,000 excl. tax. The price is of course higher for people with more design experience, not sure why it peaks at the 16-20 years of experience. We also see that more tactical and strategic roles have higher price, which should be natural.
If you are looking for more data and insights, there is the Premium and Premium+ plan. In these plans, you can find for example more and more in-depth insights and data about leadership, ownership, process, and responsibility, investment trends and recruitment, organization, working overtime, demography and richer salary information
Thanks to
- Everyone who has answered, shared and liked the survey.
- Everyone who helped to check and recheck the survey.
- Pexels.com and all photographers for photos.
- Tableau public for free data analytics.
Next year
Please leave your name and email if you are interested in being part of next year’s survey.
Please join Design Leadership Sweden
👉🏾 The survey is now part of the non-profit organization Design Leadership Community (please join us) 👈🏾
Previous years
Here are the results from
Way of work
To create as good quality of the data, analysis, and synthesis we work the following way
- We collect data over a few months and try so get as many answers as possible (we use our own professional network to share this survey)
- All data is collected into one file, we use the same file for analysis
- We are a working group who cross-check our individual work
- We listen to feedback to introduce changes to the survey and report
- We use professional tools like Tableau and Excel
- It’s a yearly survey which we can look at trends over several years
Feedback
Please have look at the data and numbers, if you have any feedback and questions, let us know at [email protected]