This is the result of the survey, The State of Design — Swedish Edition 2020.
The responses were collected during May and September 2020 and 468 people answered this year (hey, we got a record 🚀).
Summary
- There are different areas and levels where designers can bring value to the organization – operational, business, human and technology, all on operational, tactical and strategic level
- More companies are building their own design capability and starting to operationalize their design capability with more designers, design leaders and design systems
- The design maturity seems to be rising in many organizations.
- The rise of Design Thinking has come to Sweden. There seems to be more focus on process and tools and basic knowledge about design – Back to the basics.
- Other roles than designers are starting to use design as a tool to solve problems
- Corona hits the world and we all start to work with online tools like Mural, Miro, Custellence and Figma. More people seem to be looking for a new job, probably because of the virus. But we can’t see too much comments or patterns because of Corona.
- Designers get more mandate, respect and understanding as design matures in organisations but company politics and misunderstanding about what value design can bring is still present.
- Agile goes mainstream and designers find way to work with or around the process
- The salaries is rising but consulting fees are declining
- There is still a gap between salaries for men and women, let’s make 2021 the year where this is not an issue, ok?
- If we see beyond the survey we see a trend of greater design maturity in buying design. The questions, briefs and tasks are more precise and prepared, they are more about structuring design and create inhouse capacity to perform the everyday design work.
- Business design is becoming more and more established and are well connected to innovation and Design Thinking. We would love to hear more from Business Designers next year.
Who answered this years summary?
You can find more about who answered this year’s survey here.
What do you love?
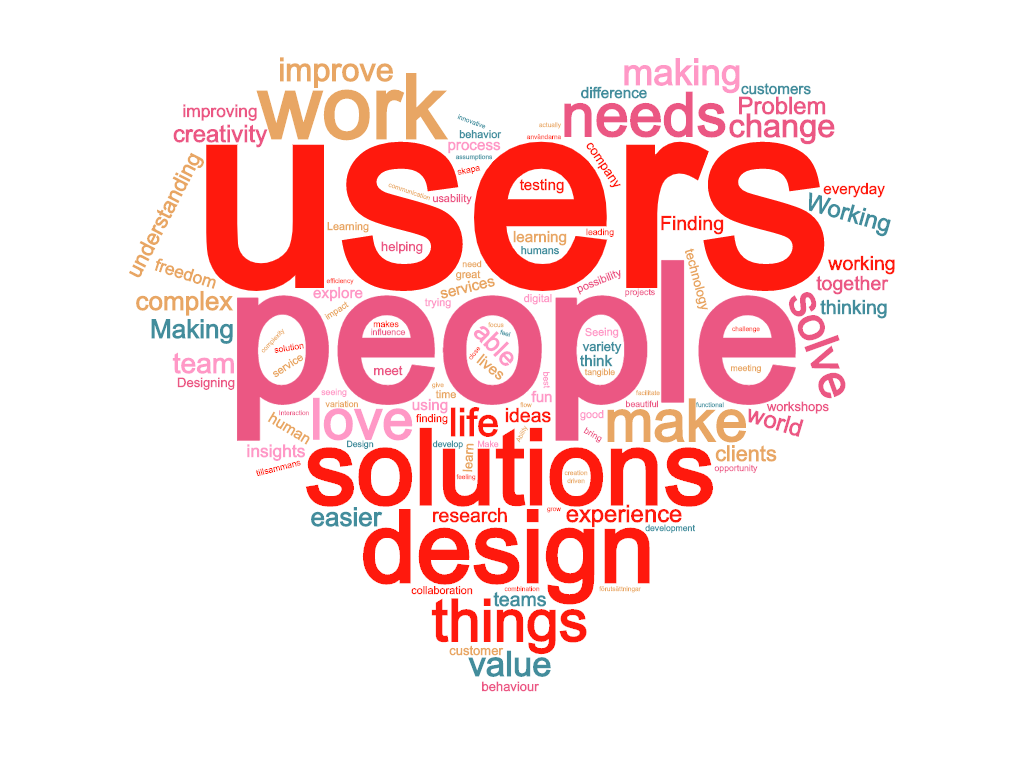
So what do designers love with their work? The majority loves to create solutions based on user needs, problem solving, collaboration, everyday variation and the possibility to create a better world. But it’s also common to appreciate the craftsmanship of design, the business perspective of design, as well as leading change, developing others as well as one selve.
Here are some common words, including some quotes below.
- Solving problems through collaboration and creative thinking, create value for customers, challenge existing thoughts and biases, leading change
- Being creative. Solving problems. Communication. Purpose.
- The challenge of creating value for both users and business, constantly trying to find the sweet spot.
- The mandate to do the right things
- No day is the same and I get to be curious, creative and solve problems.
- Support the organisation in finding a balance between stakeholder perspectives. Being let in and hear/see people’s experiences.
So what is less fun?
We don’t see any big changes from last year. Most designers fight for about the same things. Respect, understanding & craft time. Designers often have to explain and convince other people in the organization about the work and value they bring. Designers often have to cope with lots of meetings, organizational bureaucracy and having hard time to meet the “real” customer. What’s new this year is comments about working for themselves and from home, because of the Corona pandemic situation.

- Others do not understand what UX design is, and therefore being undervalued in terms of importance for a project.
- Downscoping, no budget, conflicting managers, lack of design maturity in the organisation
- Corporate politics; when higher-ups decide things against all evidence and against better knowing, for the sole reason of gaining power/bereaving an opponent of power
- Working with clients that have different values than me.
- Unnecessary meetings
- Besides the corona isolation is being the only designer at the company.
- Constantly explain what it is that I really do, to people that really aren’t listening.
What are good qualities as a designer?
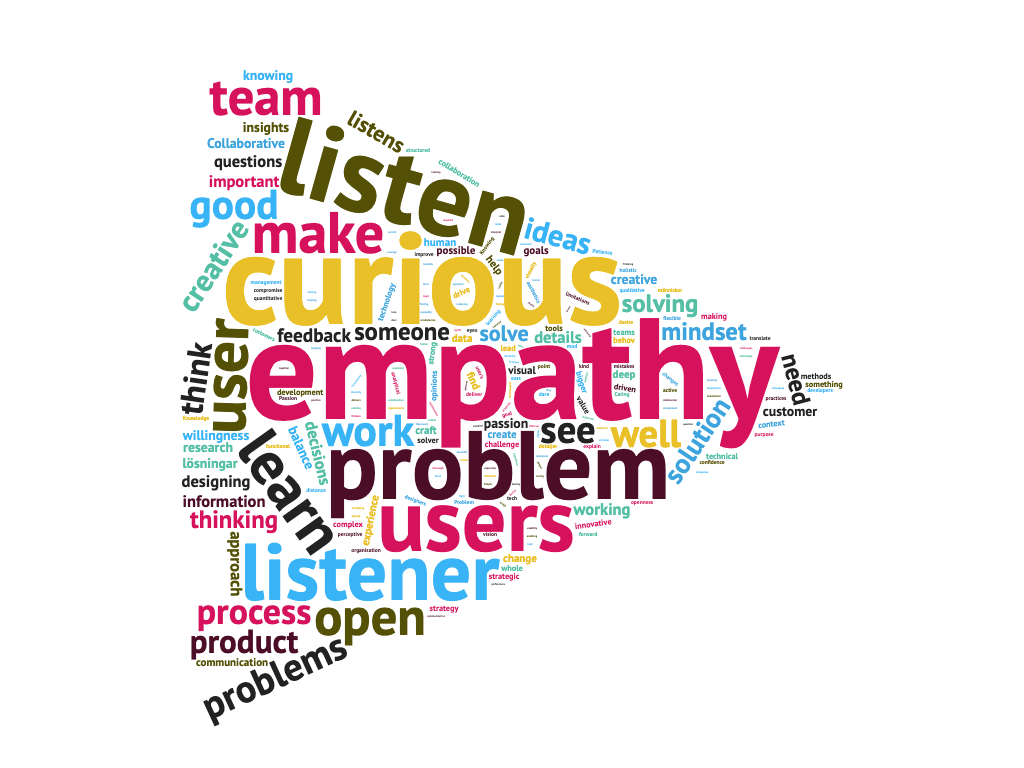
So what makes a good designer? The qualities designers see in other good designers are empathic, humble, curious, communicative, open minded, willing to learn and a good listener. But also to be able to zoom in and zoom out, to see the bigger picture and attention to details, as well as be stubborn and at the same time unpretentious.
- Empathy, business oriented and creative
- Have an eye for details but can also zoom out to see the problem in a broader sense, problem-solver, team player, prestigeless
- Somebody who can communicate well with different roles, has mastered methods that help to take some steps forward. Like playing tennis. You can see from the distance if the ball is high or low and see where you should stand to get it.
- Good balance of user, tech and business perspective, a good listener, unbiased in testing.
- To be open-minded, including, and curious.
- Someone who prioritizes human centered approach in balance with business outcomes and technological opportunities. Uses qualitative and quantitative data to inform decisions
- Collaborates well with other disciplines. Follows a solid design process. Curious and always learning
- Asking why something is the way it is. Understanding the purpose of things. Being creative, either by themselves or by enabling others to be creative.
What is important for you right now?
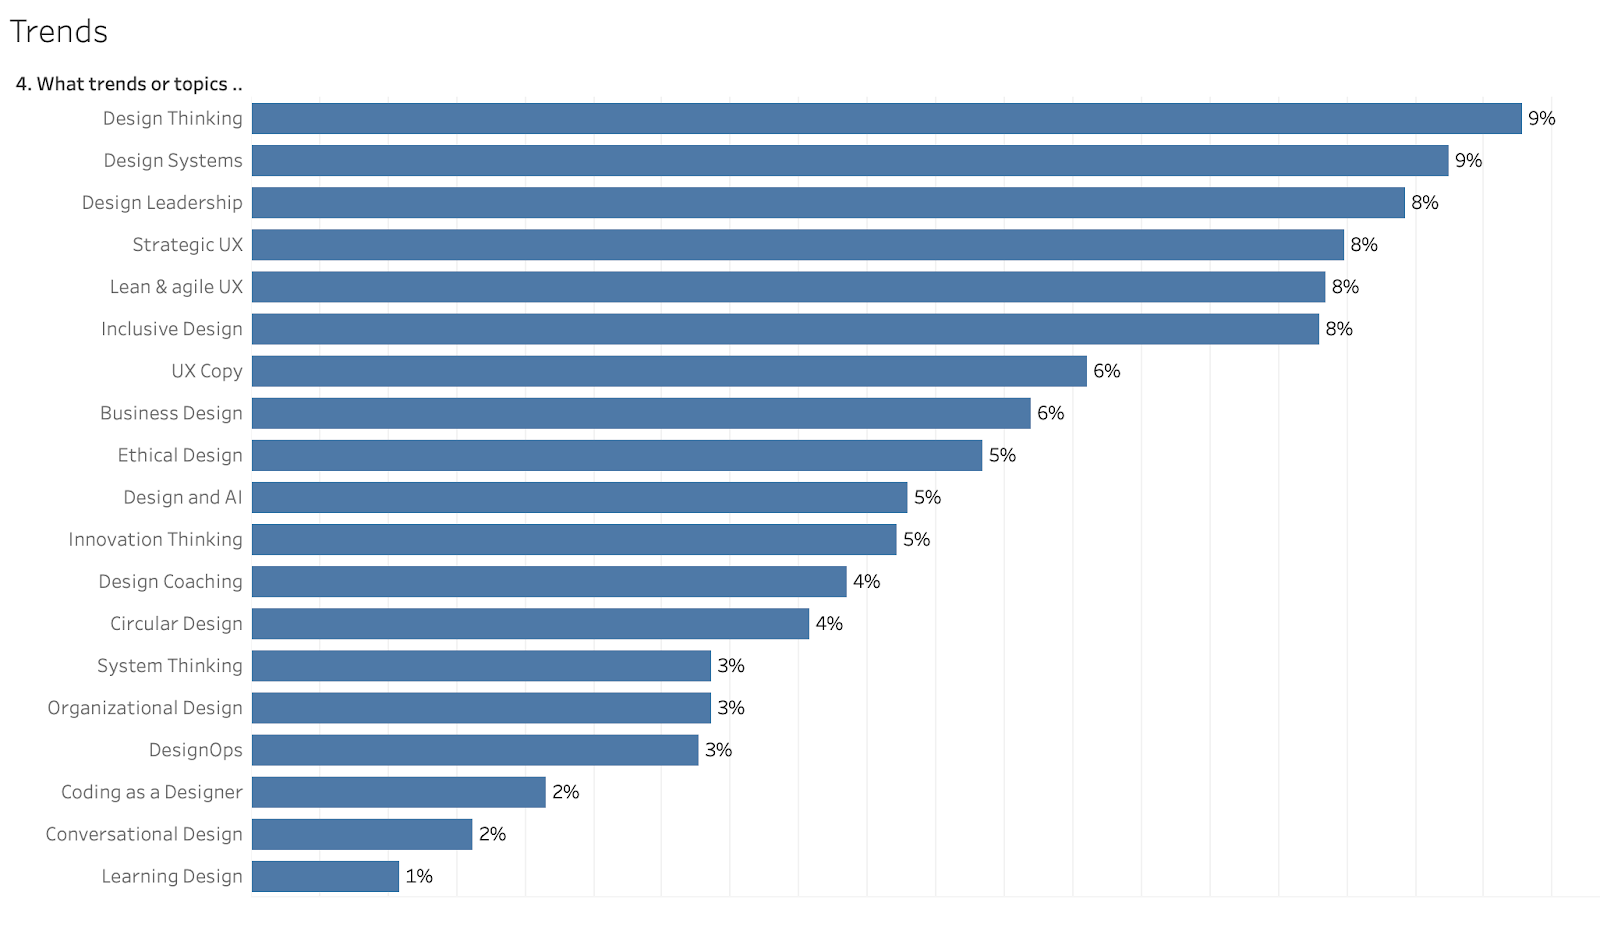
This is a question we introduced last year, just to get an understanding of what trends and topics that influence and are important for designers and leaders.
The big surprise this year is that Design Thinking is at the top. Design Thinking has been around for a while and we can’t really tell why it is trending? Can it be because of the popular book Design Sprint, which is based on Design Thinking and Double Diamond? We also see that Design Thinking is used more by other than designers, like business people and on other levels, then just operative design work.
The trend from the last few years that more and more designers work in product- and service companies and governments is continuing. This probably means that more and more companies and governments have started to build their own design capability – wonderful! This is also visible in the fact that Design Leadership is getting higher ranked in trends and there is a need to structure the design work. Design Systems is still an important topic, probably because of more design in the enterprise.
Ethical and inclusive design is still trending. We can’t compare the data from last year as we have divided the two options (last year it was one option). What we do see is that inclusive design is more important than ethical design in the survey.
We can’t summarize this survey without mentioning Corona, there are very few comments about the virus but not that much. We see trends that people start their own one-man consultancies. In uncertain times people often go back to “safe” companies instead of starting their own business, but we can’t see this in the numbers yet.
Agile is not trending as much as before – is it because it’s getting mainstream and normal? Designers are getting used to how to handle agile processes like Scrum by using methods like dual tracks and product discovery. We have in the past heard that many designers struggle with agile, we hope that this has settled.
We see more and more specified titles – which are grouped under Other in the survey. Some of the titles are variants of design titles such as senior UX designer, but some are titles like change manager. Interesting trend, let’s see what happens next year.
Other topics that was mentioned was: Accessibility, Brand Design, CO-Design, Critical Design, Data driven conversion, Design + agile + lean, Design engineering, Design Sprint, Designing for Growth, experiment-driven design, Enterprise Design, Environment-centered design, Legislation and regulation for companies with digital products, Participatory design, Radical transparency, post-agile methods, Rights based design, Sound design, Storytelling, teaching design, Sustainability, future resilient design
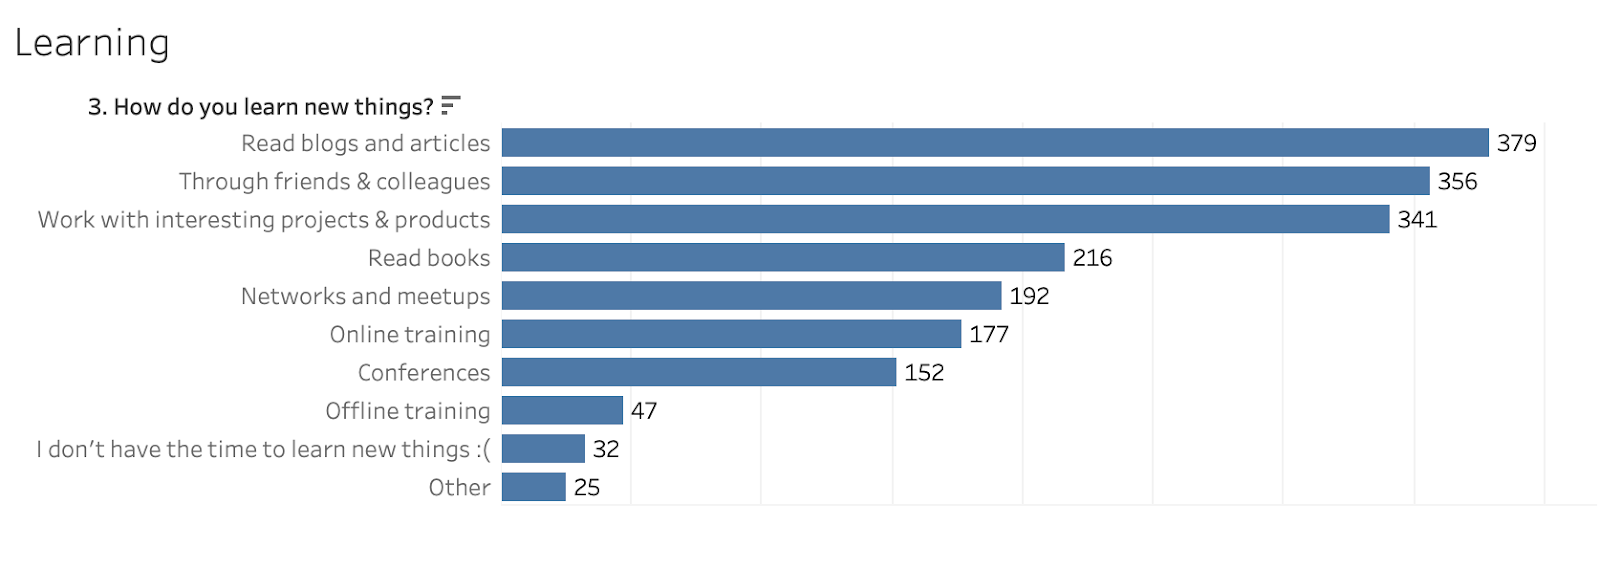
How do you learn new things?
Most designers learn by reading online, through colleagues and friends and working on interesting projects and reading books. Conferences and offline training are on decline from last year.
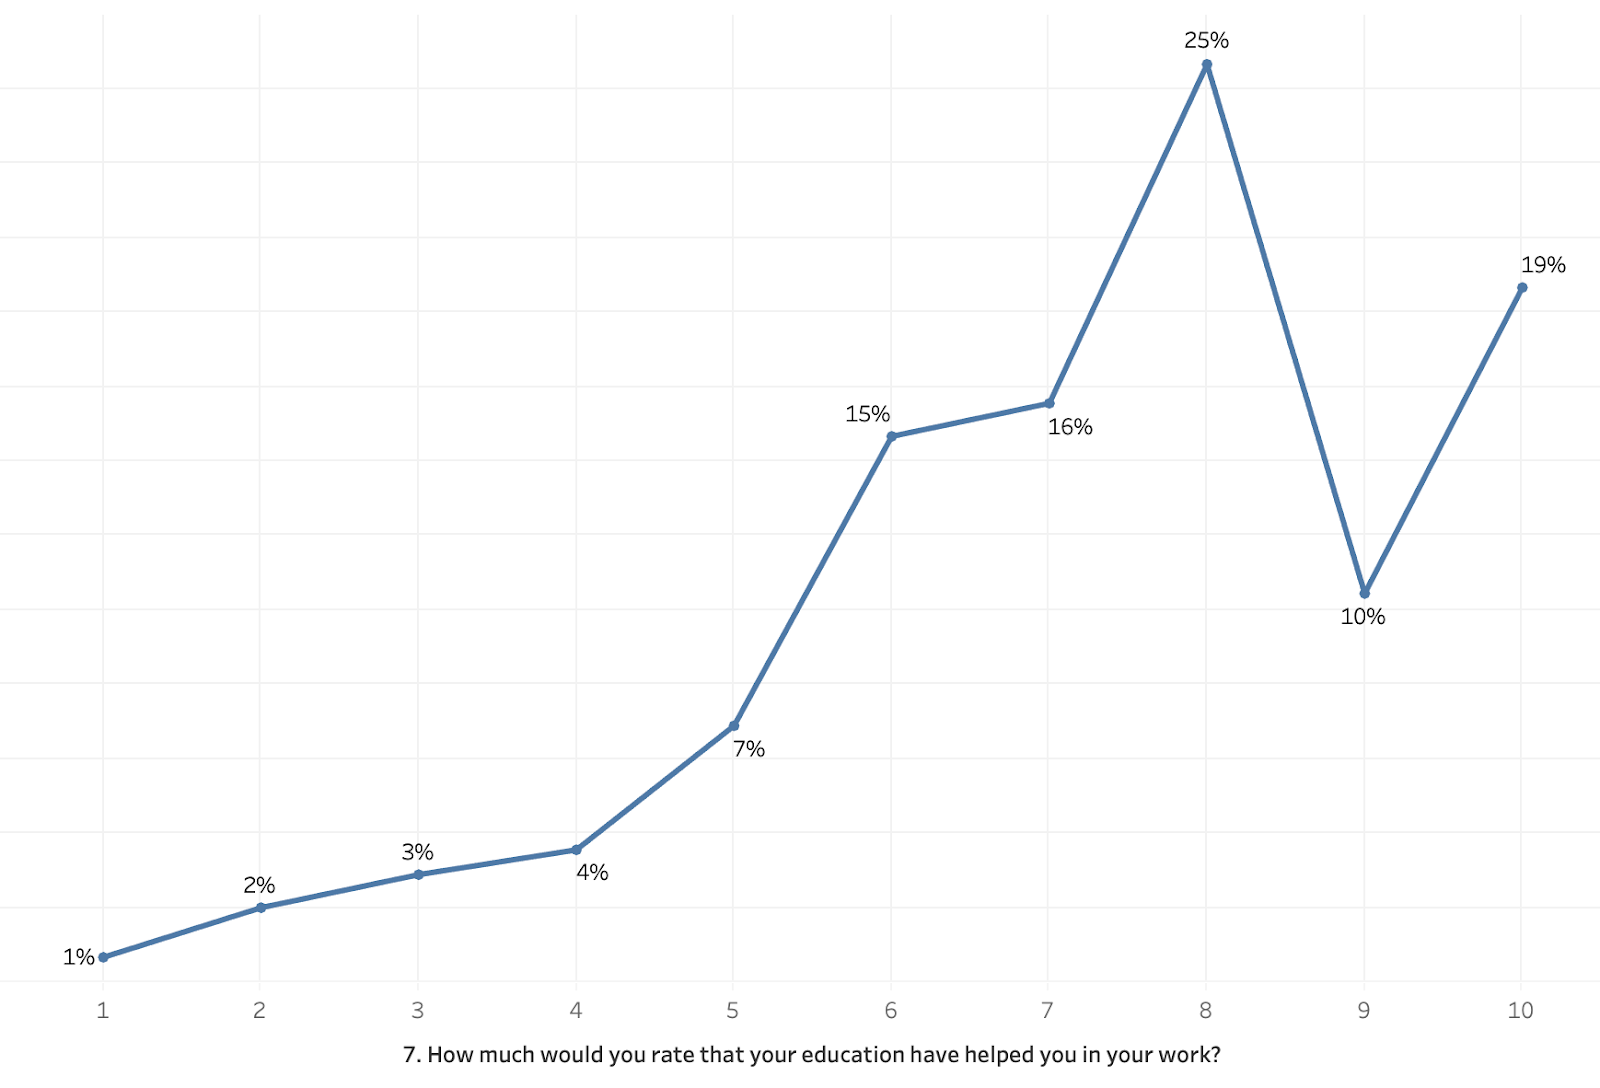
How much do you think your education has helped you in your daily work?
A majority, 70% (who answered 7-10) believe that their education helps them in their daily work.
Our take: How can we improve the design education institutions so that it really prepares students for work? 3 out of 10 still think their education needs to improve. We would love to discuss this with schools and companies.
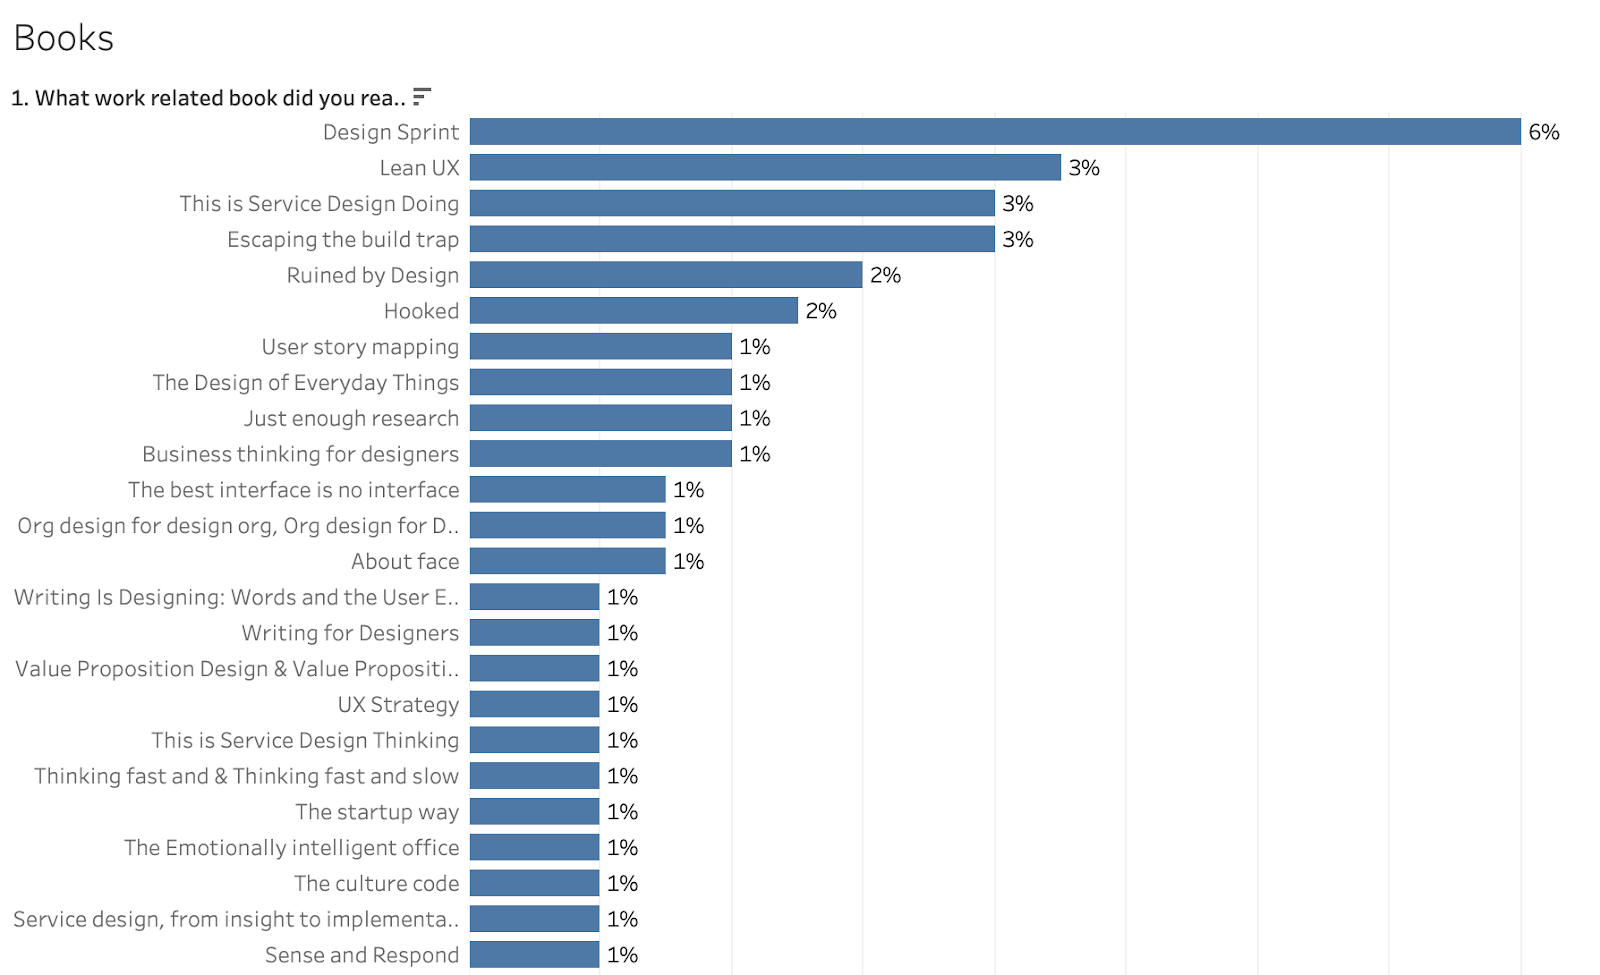
What work related book have you read recently?
This year The Sprint book is the number one book. On the second place comes Jeff’s and Josh’s book, Lean UX. One the third comes This is Service Design Doing
Other popular books are: Escaping the Build Trap, Ruined by Design, Hooked, User Story Mapping & The Design of Everyday Things. Note that all boks are not shown
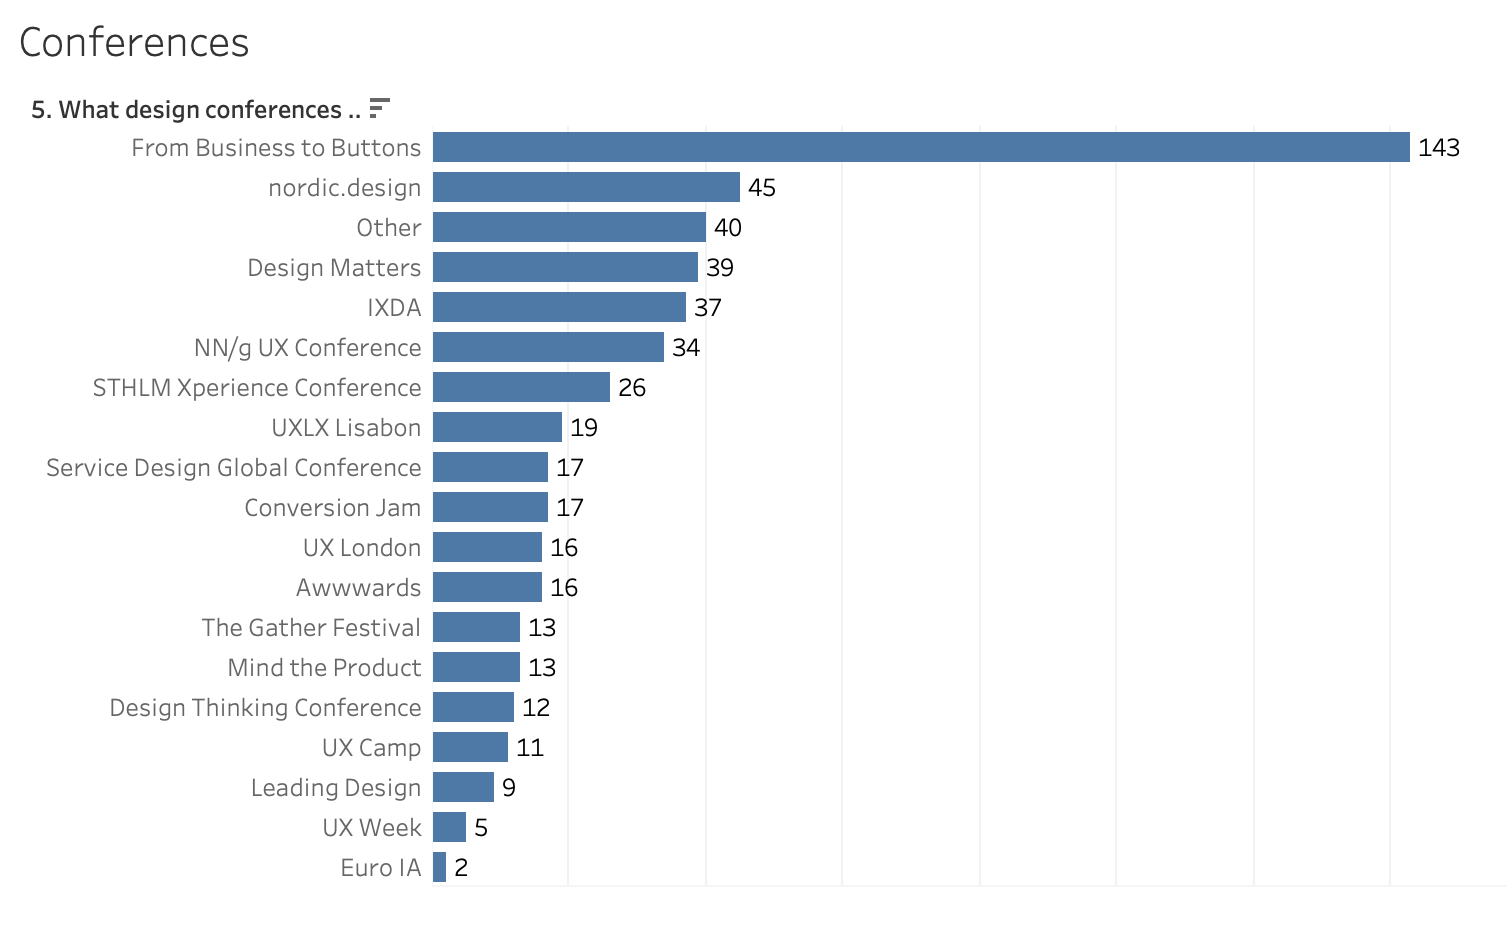
Which design conferences are the best?
So where do designers go to learn new things, network and have fun? From Business to Buttons (too bad it was postponed this spring) and nordic.design are most popular in Sweden together with Design Matters, IXDA, NN/g UX Conference and STHLM Experience Conference.
In the other bucket you can find: An Event Apart, CHI, DesignOps Conference, SWSW, UXDX and many other
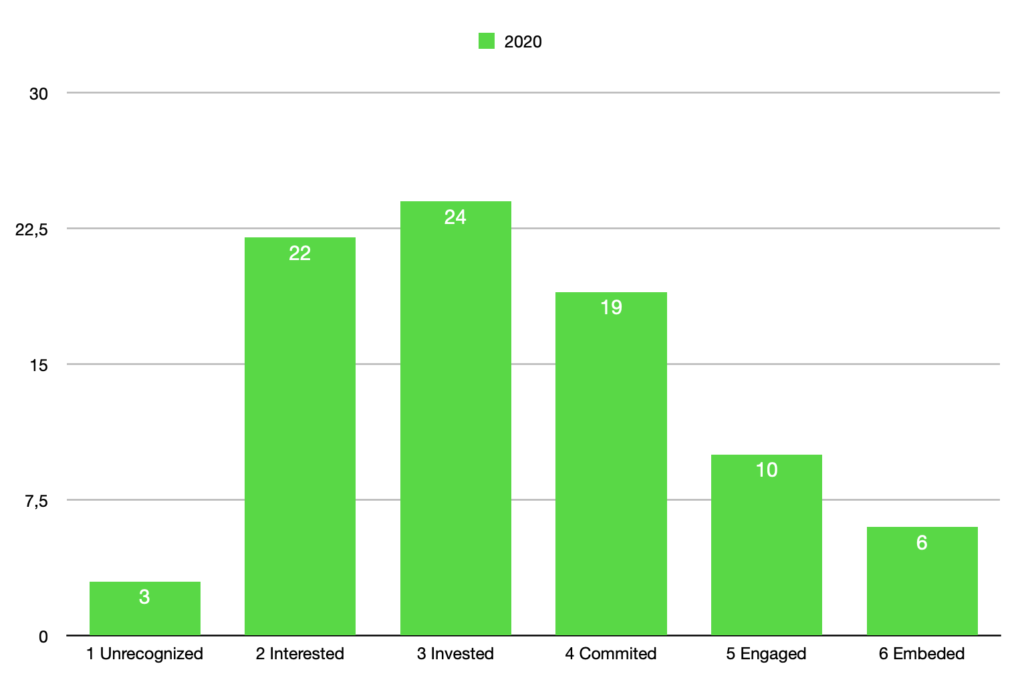
What maturity level do you think design is in your organization?
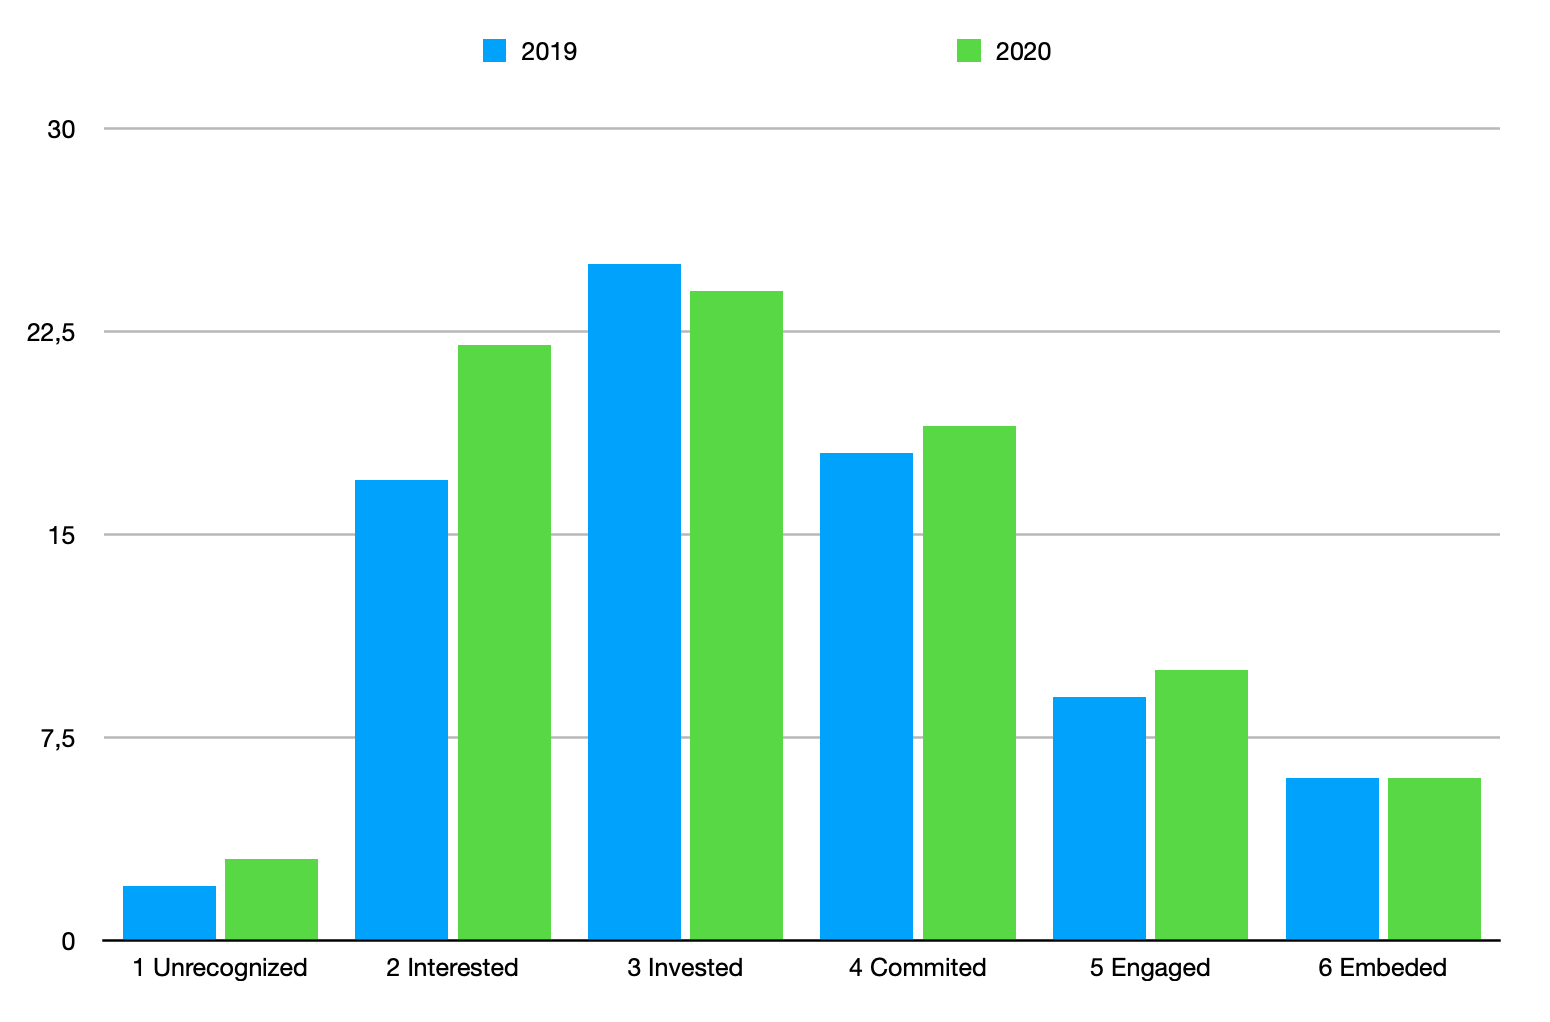
This year “4. Committed” and “5. Engaged” went up which is good. But on the bad side “1. Unrecognized” and “2. Interested” also went up with a small decline for “3. Invested”.
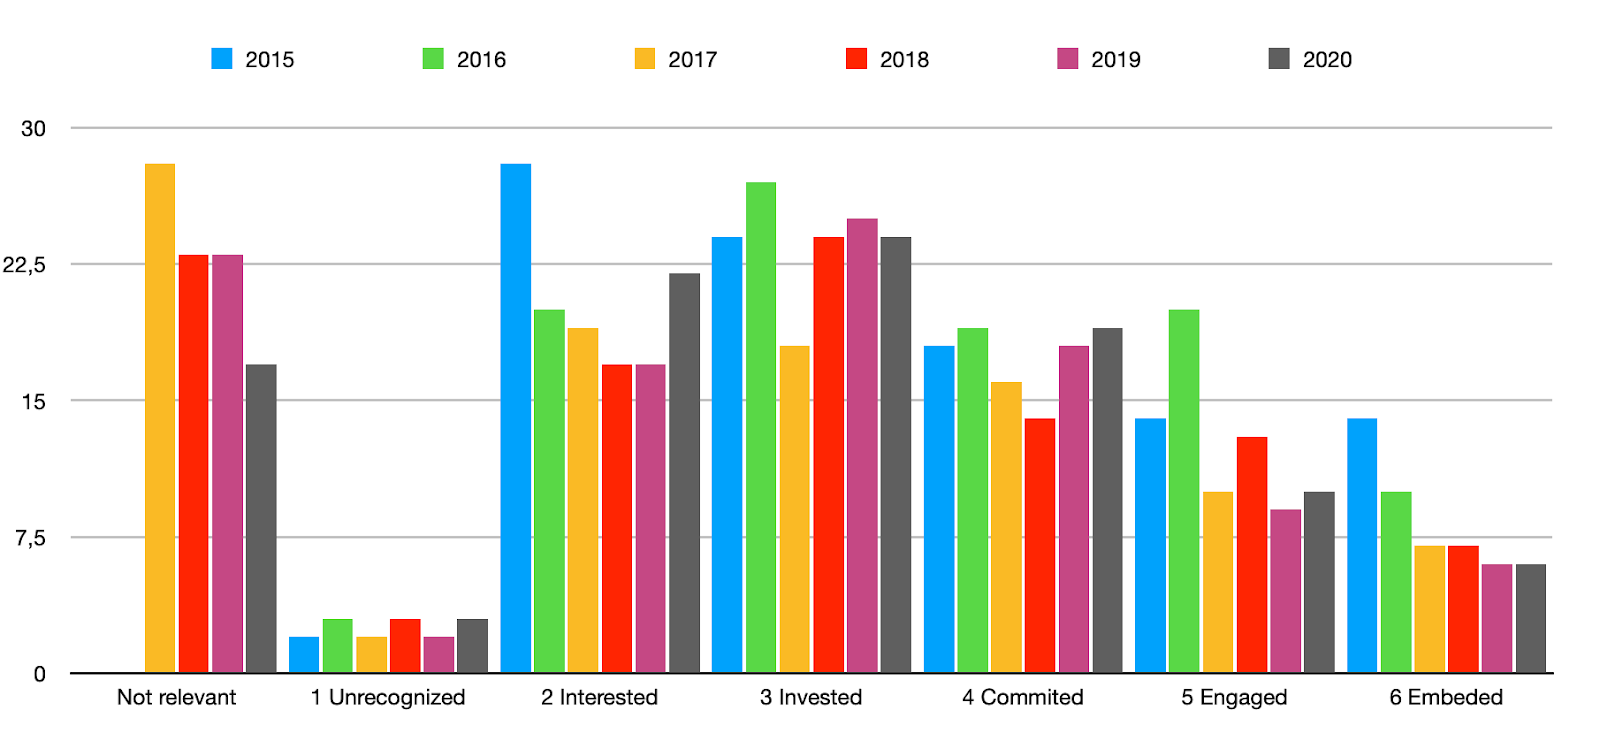
Our take: These numbers are always hard to interpret. The study shows there is a movement to the right which is good. If you look at the trends from 2015 we now can see a positive trend this year in many segments.
2020
2019 vs 2020
Maturity index from 2015 to 2020
From 2017 the design maturity index has risen, even if it is only small rise.
Please note that 2015-2016 did not have the option “0. Not relevant” which now get no score at all, that is why the numbers are higher those two years.The index is calculated the higher maturity the higher score which is multiplied with number of answers per category.

Maturity trending from 2015
How often do you meet your users or customers?
Designers who meet their customers and users once a month or more are down from 54% to 46% this year.
Our take: It is ok that 46% of designers meet their customers and users once a month or more. We would say that meeting your customers is vital when you work with human centered design. And for you who aren’t allowed, can’t get financing or don’t have the mandate, use this survey to show how other companies do it. It is not rocket science and quite cheap, just do it 💪

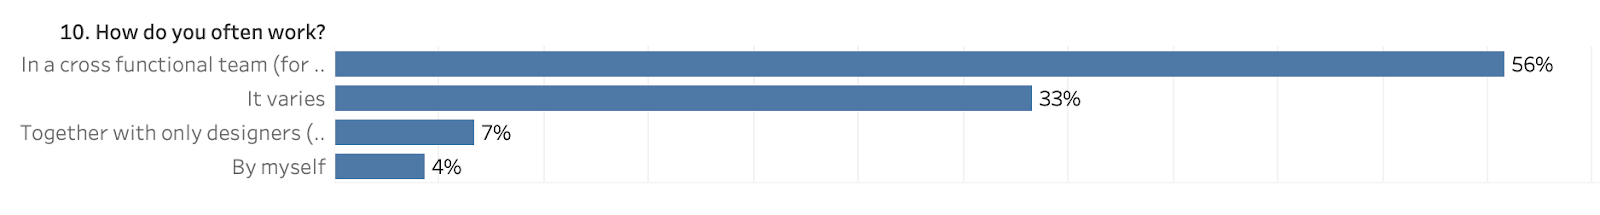
How do you often work?
Working in a cross functional team seems to be the norm these days. There is a big change in the answer “Together with other designers” which is down 16% from last year.
Our take: To create value and impact we often need to work with a mixed team who have the perspective of desirability, viability and feasibility. Most organizations today are moving in that direction.
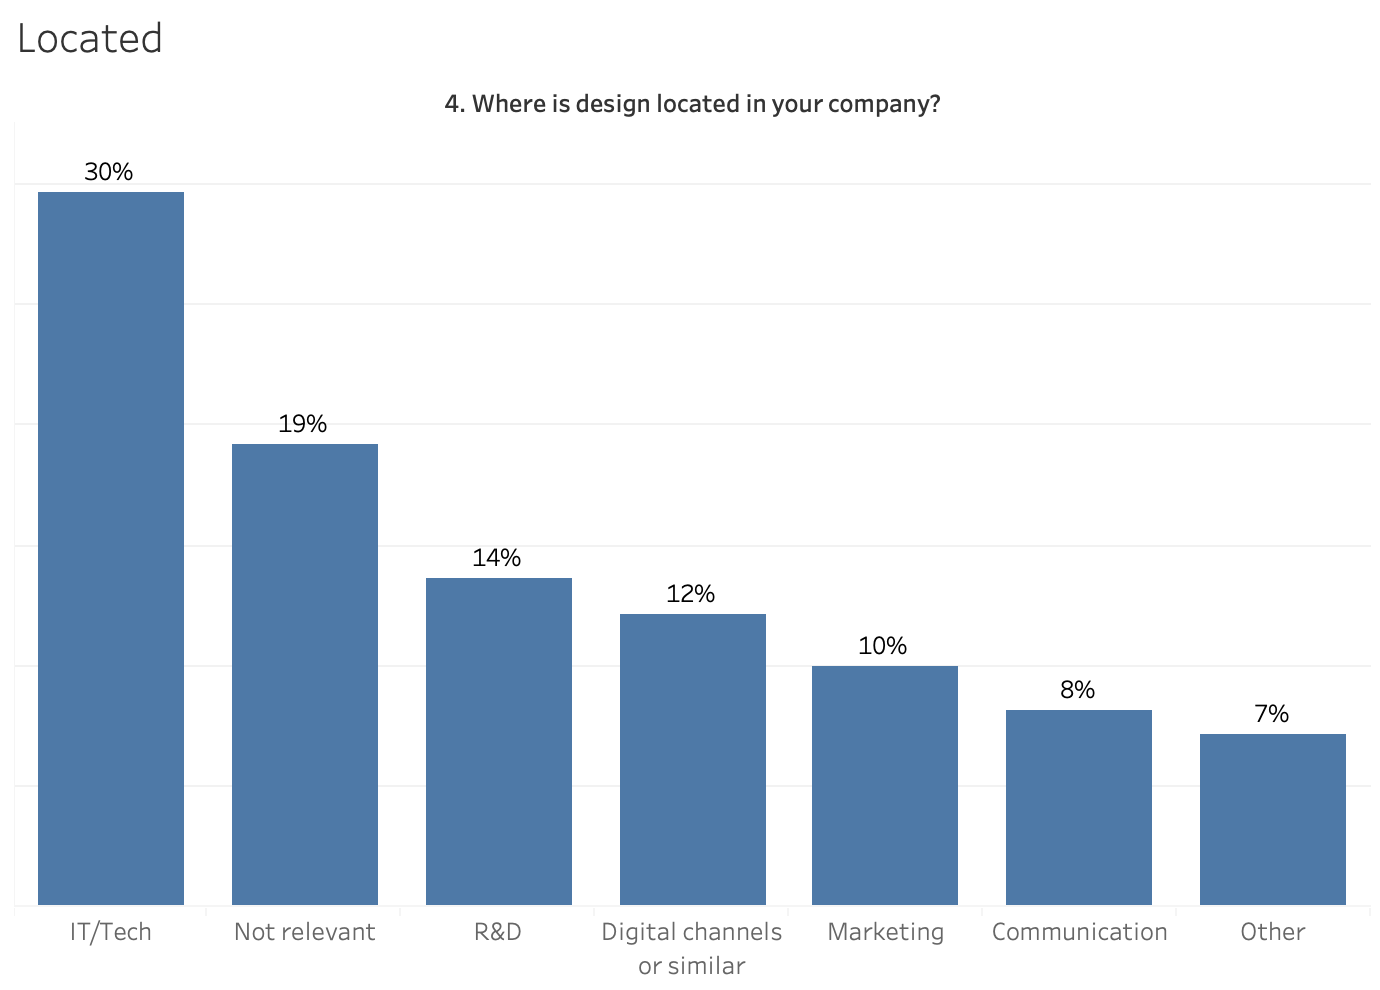
Where is design located in your organization?
Design is often located in the IT organization, R&D, Digital channels or Marketing.
Our take: It is interesting to see that most designers are still under the tech organization. We would love to see more designers embedded in the product functions or under their own design organization (where R&D, marketing, communication and product/service design can live together). Are there more organizations starting to organize themself around the customer journey or value streams?
When people answer Not relevant is often because they work in an agency or are consulting.
What kind of work?
81% of designers work in both problem and solution space. The question was, what kind of work do you do as a designer, is it only solutions, wireframes and visual design or is it to understand the problem and be part of the whole process (where 0 is only solution and 5 is whole process)?
Our take: It’s nice to see that most designers are part of both the problem and solution space and are able to work in the whole process. If you are not, show these numbers to your manager and explain what you need and why you need it.

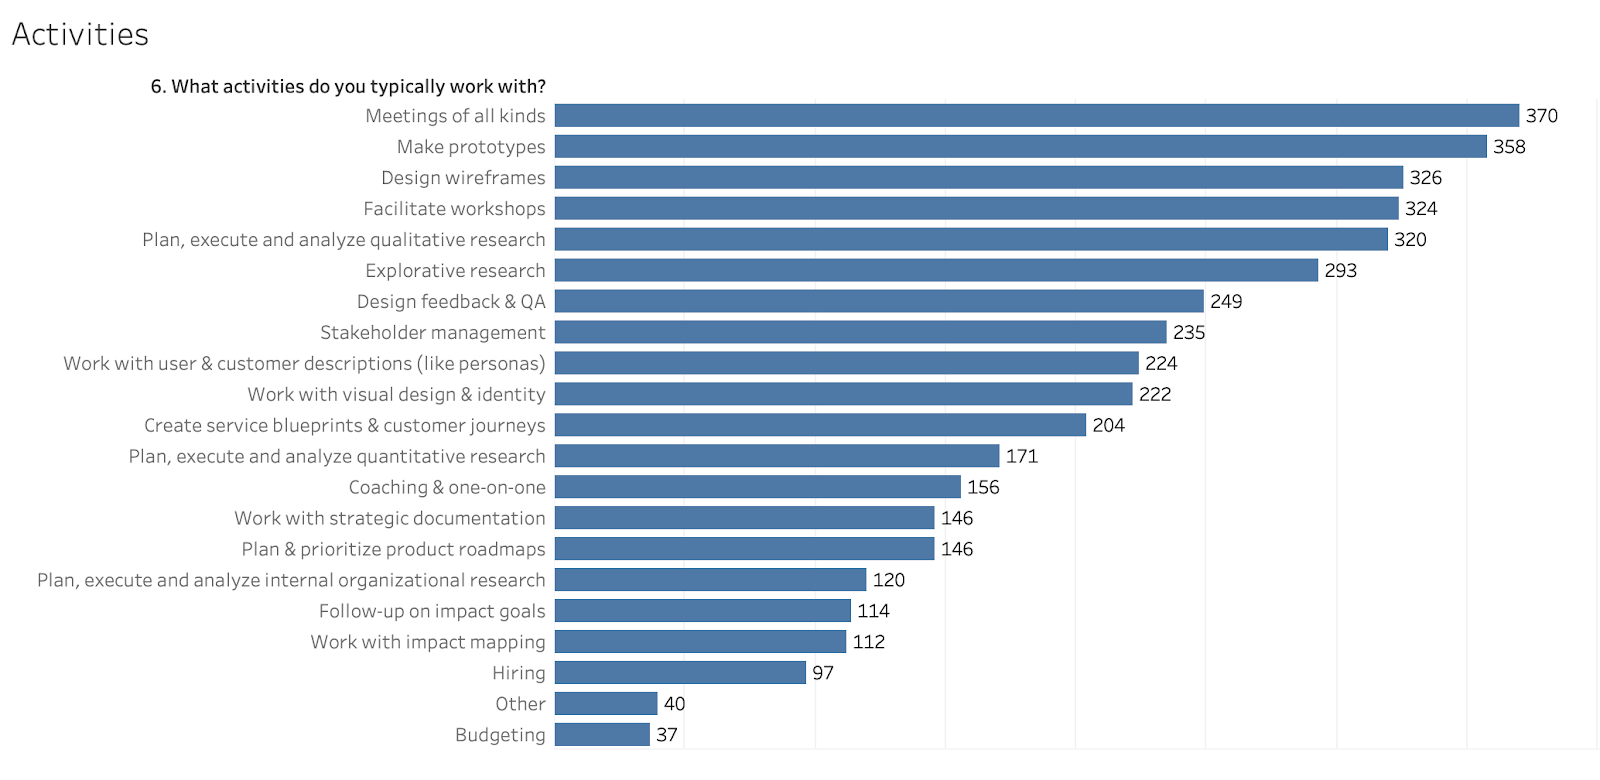
What are common activities & methods in your daily work?
Except general meetings, designing solutions and research are number one activities.
Our take: Designing is of course a key activity for many. It is nice to see that mixed research is done by many. A designer is often a good facilitator to create alignment, it’s a core skill that is needed. We would like to recommend designers to do more design feedback to increase the quality over time. Impact mapping and roadmapping is also something that would increase the impact over time.
Typical activities
Common methods
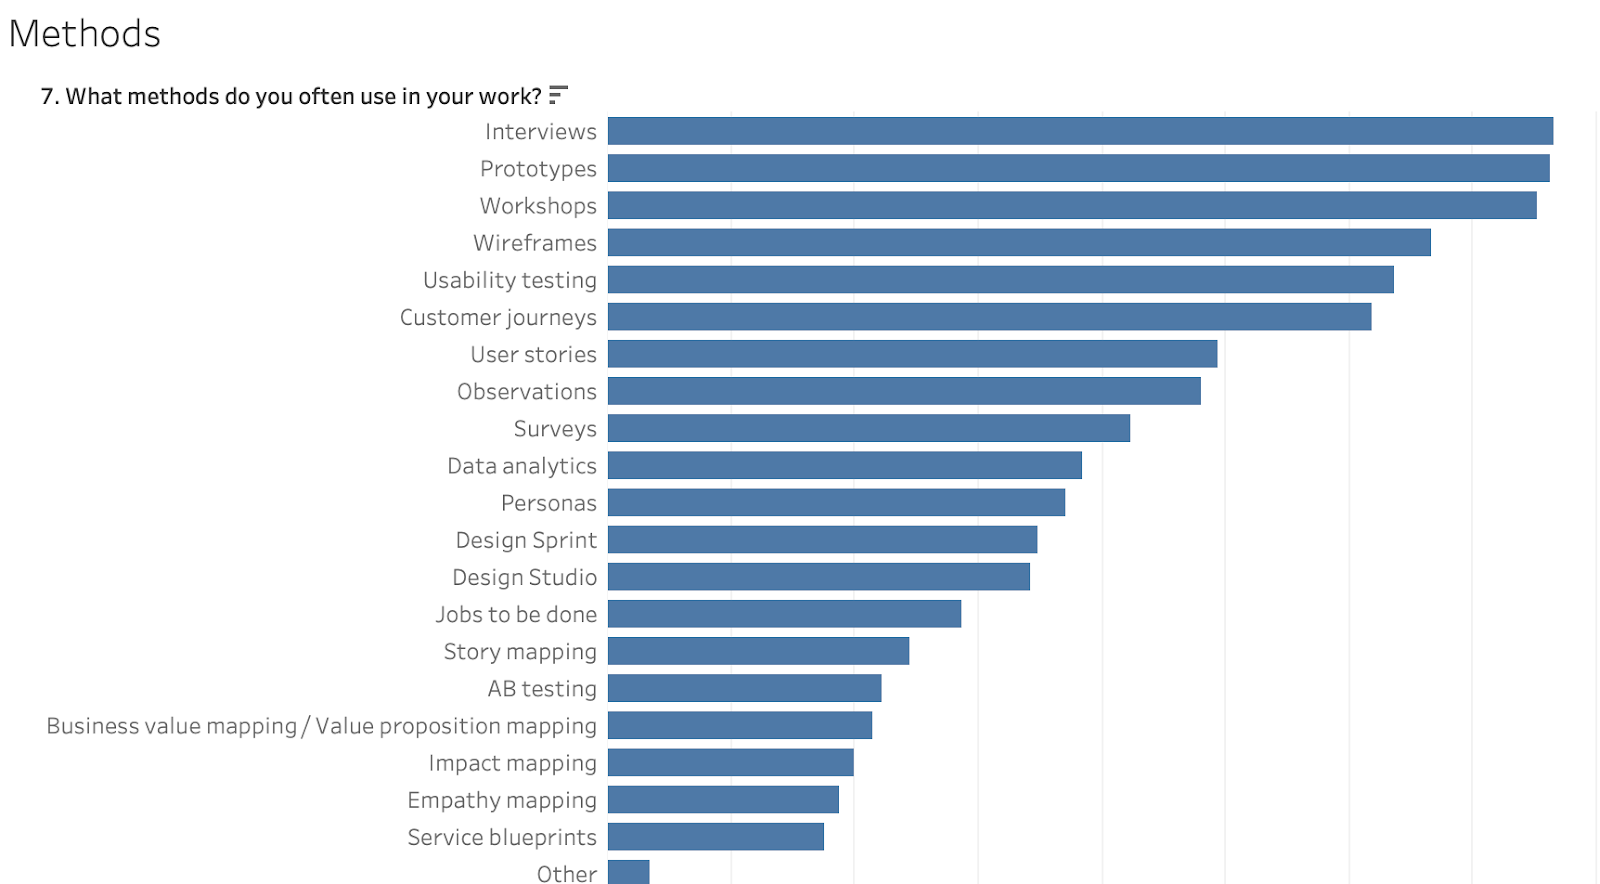
What are your tools and programs?
Paper and pen, keynote or powerpoint and Sketch are popular tools, just like last year. Trello and Jira are new ones and Figma are up from 11th to 6th place this year.
Our take: It is really nice to see that paper/whiteboard and pen is the number one tool for designers, who could have known. It was also a surprise that Powerpoint & Keynote is such a common tool. We thought that Figma should be more popular than Sketch, but not this year. Of course Miro and Mural have gone up as we all are working remotely.

What process, method or tool would you recommend to other designers and why?
Here are some responses from the open ended question about process, methods and tools.
Methods
- Personas, Behavioural groups
- Customer journeys & service blueprints
- Mixed research
- Use of design systems
- Business impact mapping
- Business model and value proposition canvases
- Test & Learning Cards
- Contextual research
- Design critique
- Design Studio
- Empathy mapping
- Nielsens 10 Usability heuristics
- Jobs to be done
- Usability testing
- User story mapping
- Pen & paper
Tools
- Figma
- Abstract
- Adobe XD
- Mural
- Miro
- Custellence
- Hotjar
- Maze
- Notion
- Sketch
- Zeplin
Mindset
- Design sprint
- 6 thinking hats
- Product Discovery & delivery approach
- Collaboration with stakeholders and the whole team In the whole design process
- Hypothesis and validation approach
- Be open minded and ask why
- Co-creation with customers
- Design Thinking & Double Diamond
- Dual track scrum
- Lean UX
Do you have ownership of the design questions in your organization?
The average has gone up this year from 6.6 to 7.2, an all time high since we started this survey.
Our take: Can this be related to that the design maturity has increased this year? This is a good question to ask in your organization.
Is it clear in your organization who is responsible for design?
It’s only about half (55%) who answered it is clear who is responsible for design in the organization.
Our take: Who should be responsible for design in the organization, would you say? If this is unclear, try to lift this question in your organization. Of course there is not a black and white answer, many times many functions or teams have this responsibility. But knowing who to talk to and collaborate is a good start.

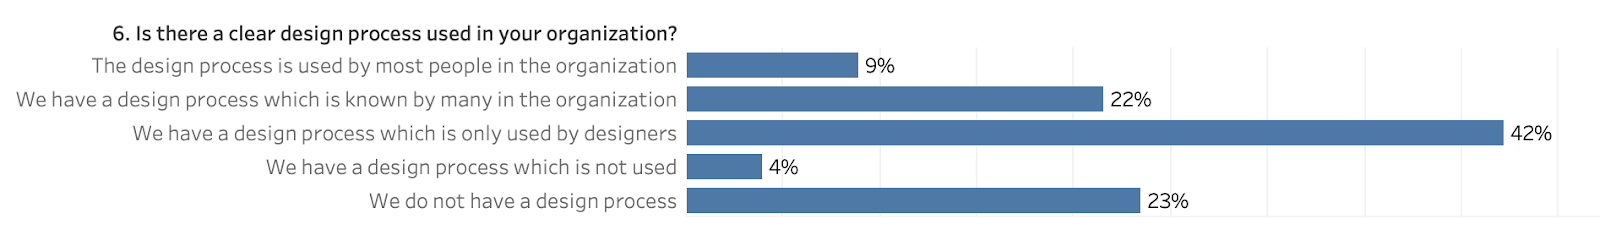
Is there a clear design process in your organization?
The study shows that 27% of people who answered say they don’t have a design process or it’s not used. On the other side 73% (67% last year) answer that they have a design process which is used in various degrees.
Our take: A design process is a good way to measure the maturity of design. It increases efficiency and quality in the whole product or service process.
Are you actively looking for a new position?
36% (20% last year) of the respondents say that they are looking for a new position.
Our take: There is a large change from last year, can it be because of Corona?

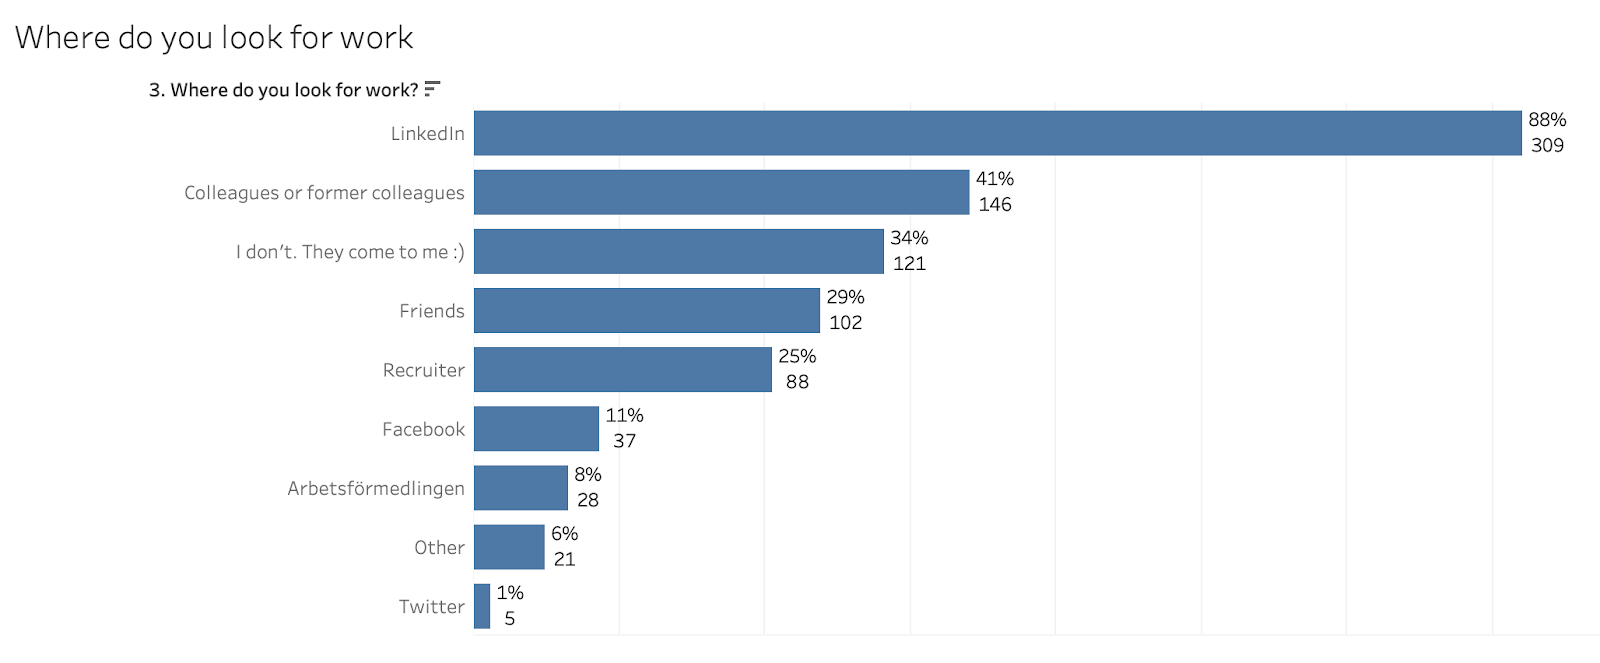
Where do you look for a job?
LinkedIn (down 5%) is still the most popular place to look for new positions. After that comes colleagues (down 17%). 352 answered this multi answer question.
Other: Indeed, Uptrail, consulting brokers, Google, Glassdoor, Blocket work, Company websites
Why are people looking for new positions?
Here are some common things that make designers want to leave their job. This is a great list for leaders and managers to make use of when hiring, doing one-on-one coaching or team building exercises.
- Another type of culture
- Bad leadership
- Bad colleagues or dysfunctional team
- Boring projects
- Consulting is no fun
- Create more customer value
- Develop and learn new things
- Less waterfall and more agile and teams
- More saying, influence & responsibility
- No challenges
- Often have to explain the design role and what value we create
- Tired and slow organization
- The organization do not want to work in a user centered way
- The working environment do not support design work
- Want a better salary
- Want a new design role, like UX lead
- Want another type of role, like product owner
- Want (more) design colleagues
- Work with non digital touch points
Salary statistics in Sweden 2020
First some information about the data (the disclaimer). Be careful to draw too certain conclusions, use this data as a starting point and remember, the salary is just one part of the job.
For those of you who do not live in Sweden, 1 Swedish Krona (SEK) equals about 0.1 U.S. dollars or 0.1 Euros. In Sweden, salary is often written per month and before income tax (the income tax in Sweden is roughly around 23–36% depending on your salary level, see more about our tax system in Sweden). The salaries below are excluded perks and benefits. The median salary in Sweden 2019 was 31.700 SEK (3617 USD) according to SCB.
450 answered the question about salary this year. 160 answered the questions about hourly price rate. The question about monthly salary has a fixed range of salary from 5.000 to 150.000 (one answer above 150.000) The hourly price rate had a fixed range from 100 to 3000 SEK excluding tax.
- Median salary for all responses (450 responses): 44.000
- Median salary for women (256 responses): 42.000
- Median salary for men (190 responses): 47.000
Median salary per gender
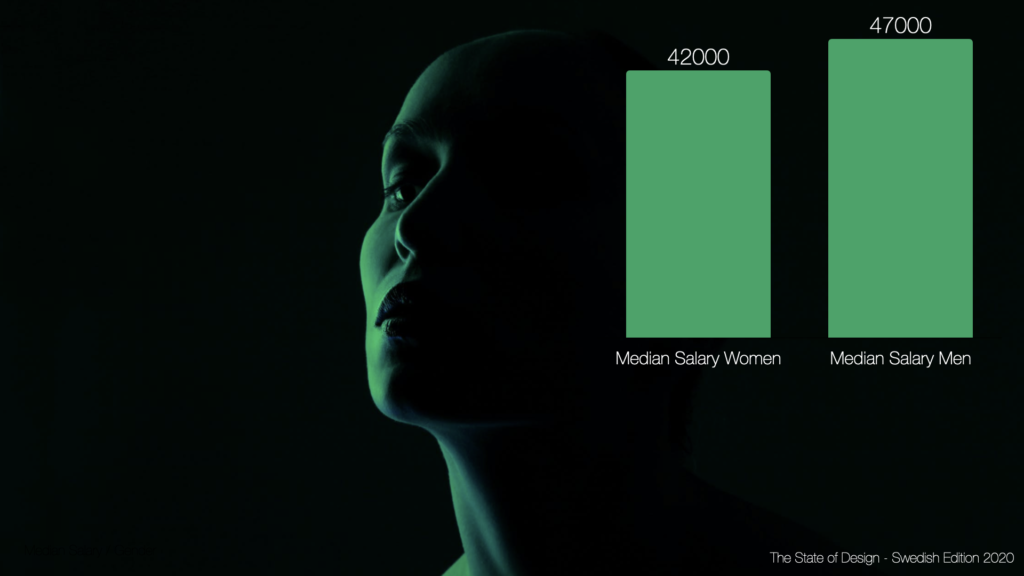
Lendend
- Male: Red
- Female: Blue/green
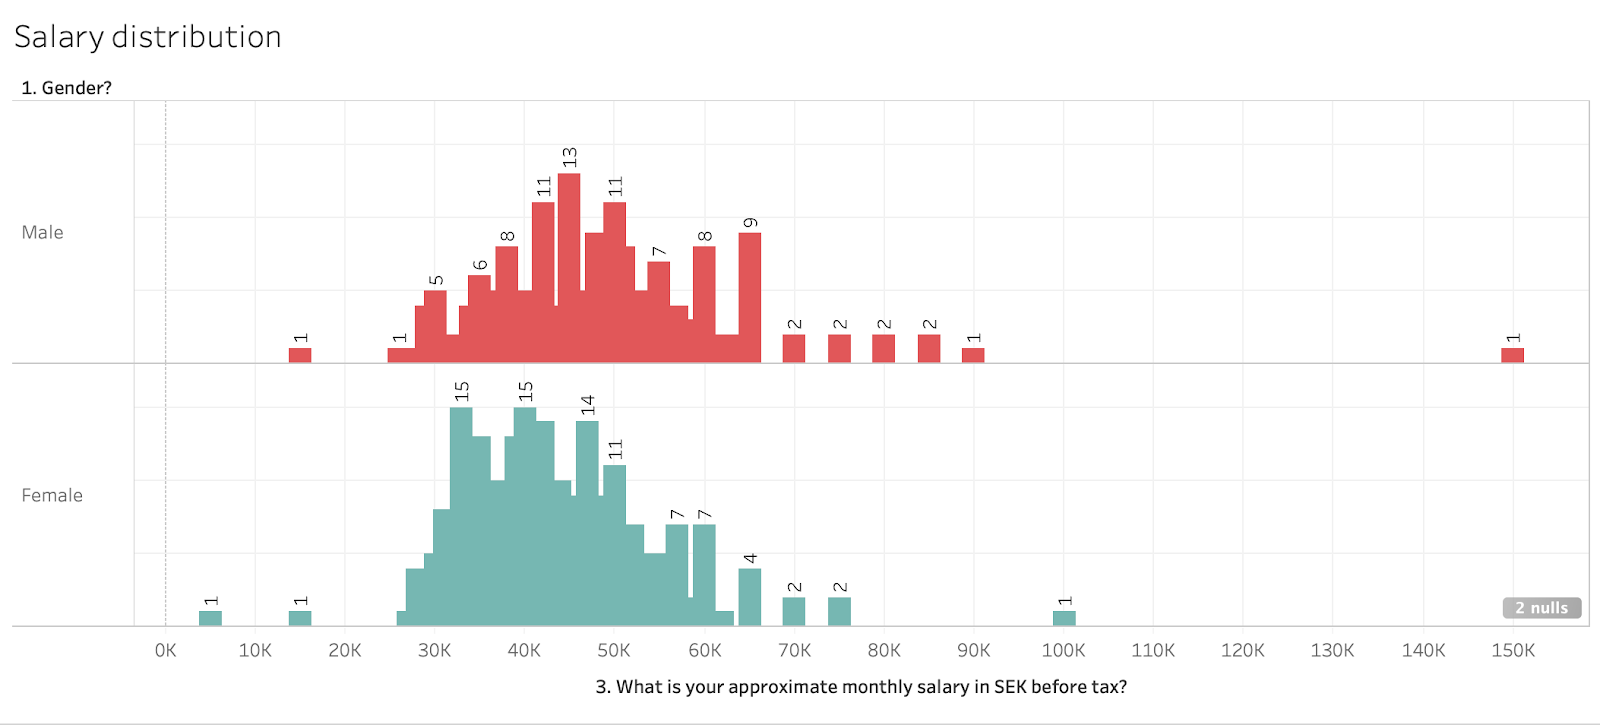
Median salary distribution
As you can see, the salary range is most common between 28–65.000
Description: The number above the bar is how many answers per group, for example 13 male had a salary of 45.000.
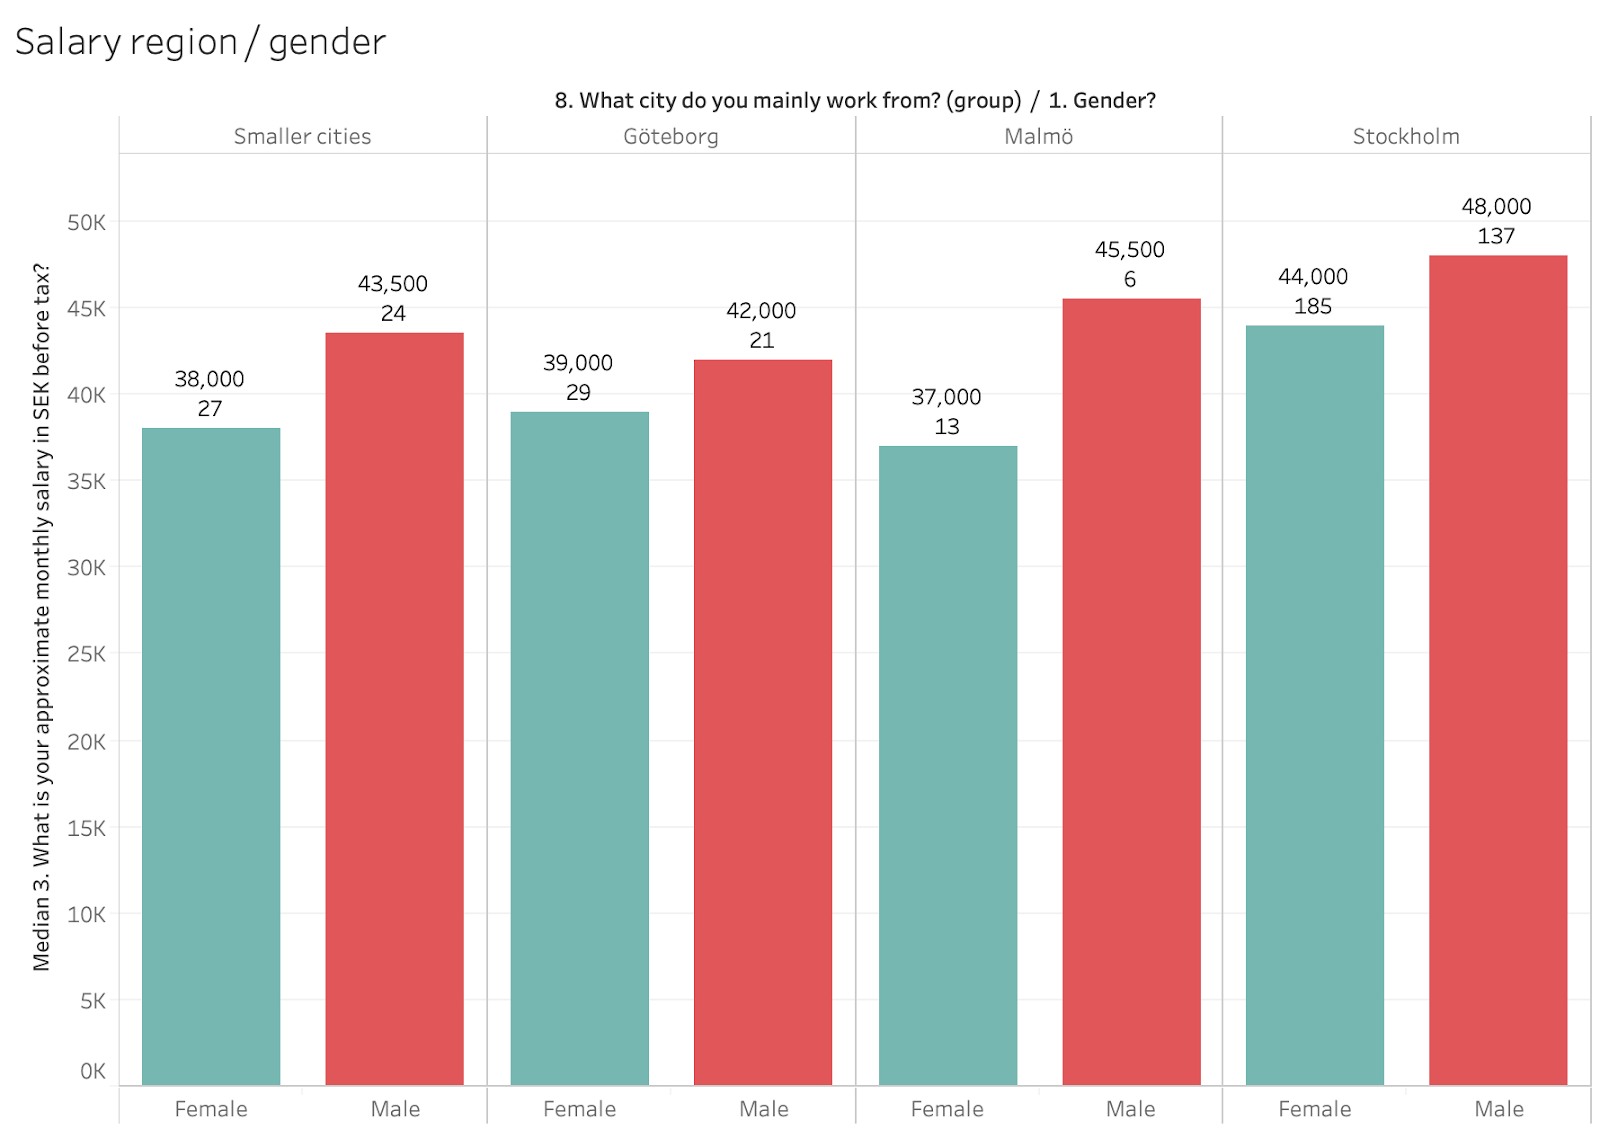
Salary per region and city
Bigger city, bigger paycheck, well not always. Here is the median salary per city and gender. We grouped smaller cities together as there were too few data points. As previous years, the salary is often higher the bigger the city is. We also included data about cost of living from an external vendor, both understanding the differences within Sweden but also with the US.
| Smaller cities | The Göteborg region | The Malmö region | The Stockholm region | |
| Female | 38.000 | 39.000 | 37.000 | 44.000 |
| Male | 43.500 | 42.000 | 45.500 | 48.000 |
| Compared from 2019 | Up 5% | Up 4% | Up 4% | Up 2% |
| Cost of living index compared to Stockholm (2) | -5%(1) | -7% | -10% | 0% |
- Used data from Linköping.
- All data from Numbeo
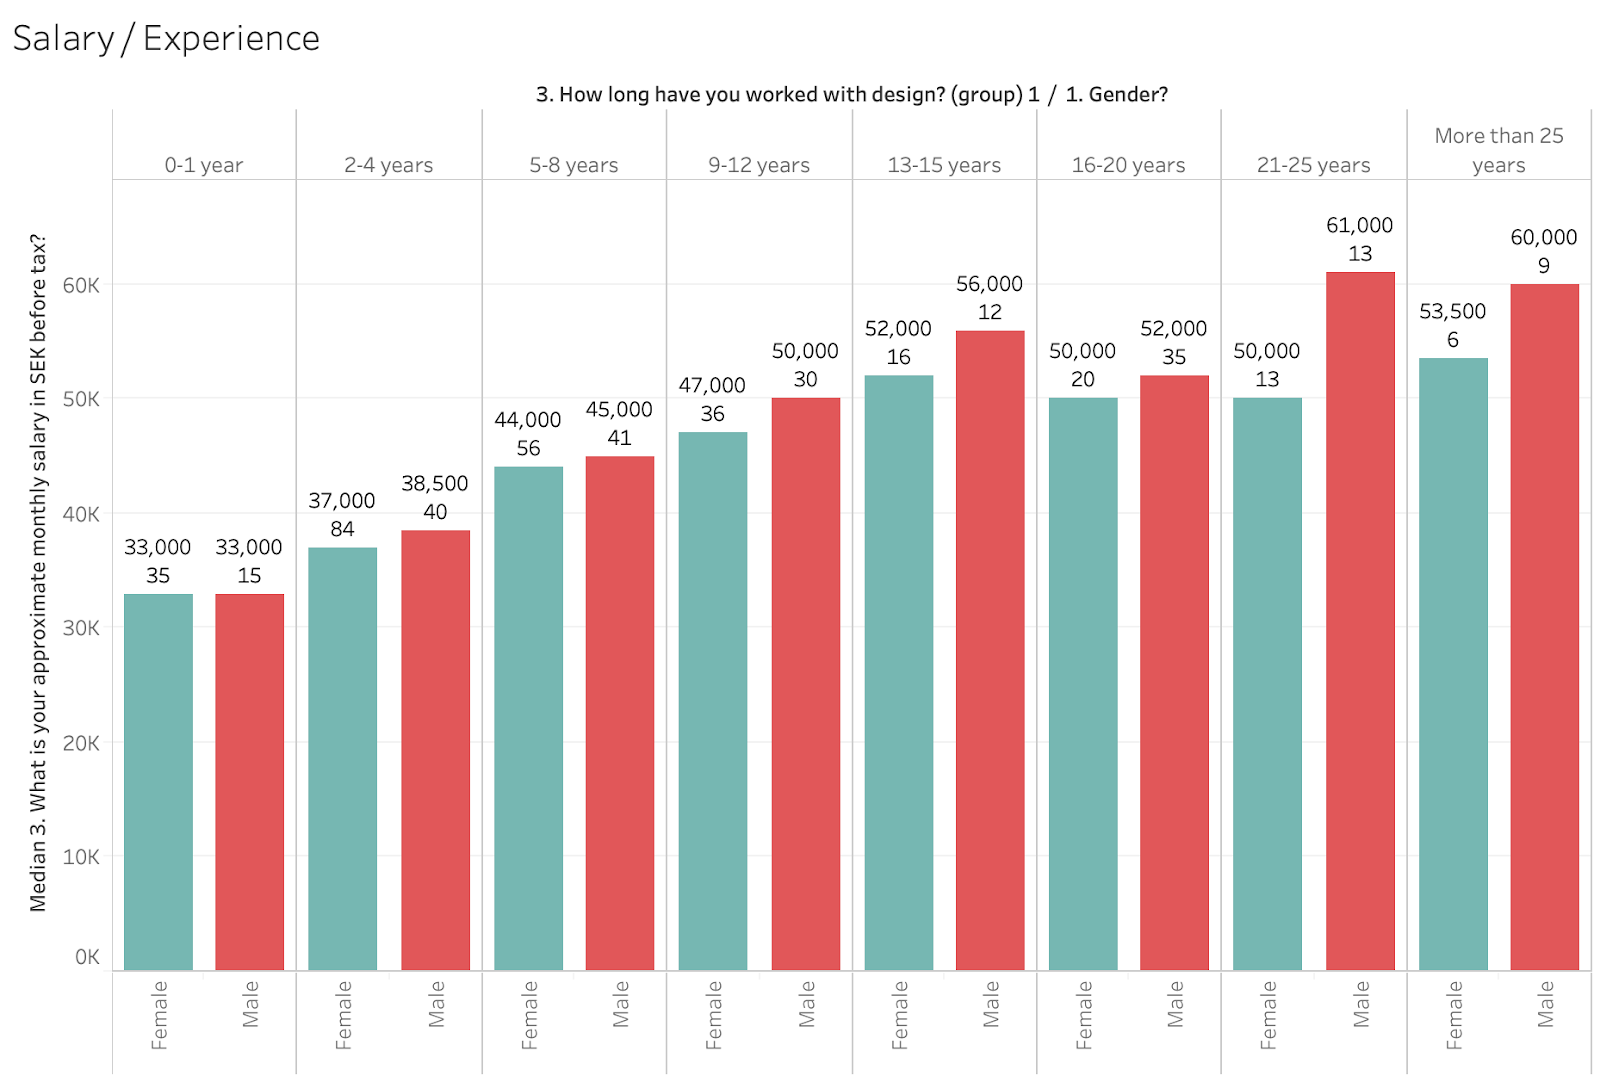
Median salary vs design experience
This is the median salary vs design experience. As you can see, the longer you work the better salary you get, no magic here.
Description: The numbers on top of the columns in the graph are the median salary and how many who answered. For example, the median salary from women with 9–12 years experience is 47.000 and 36 women answered.
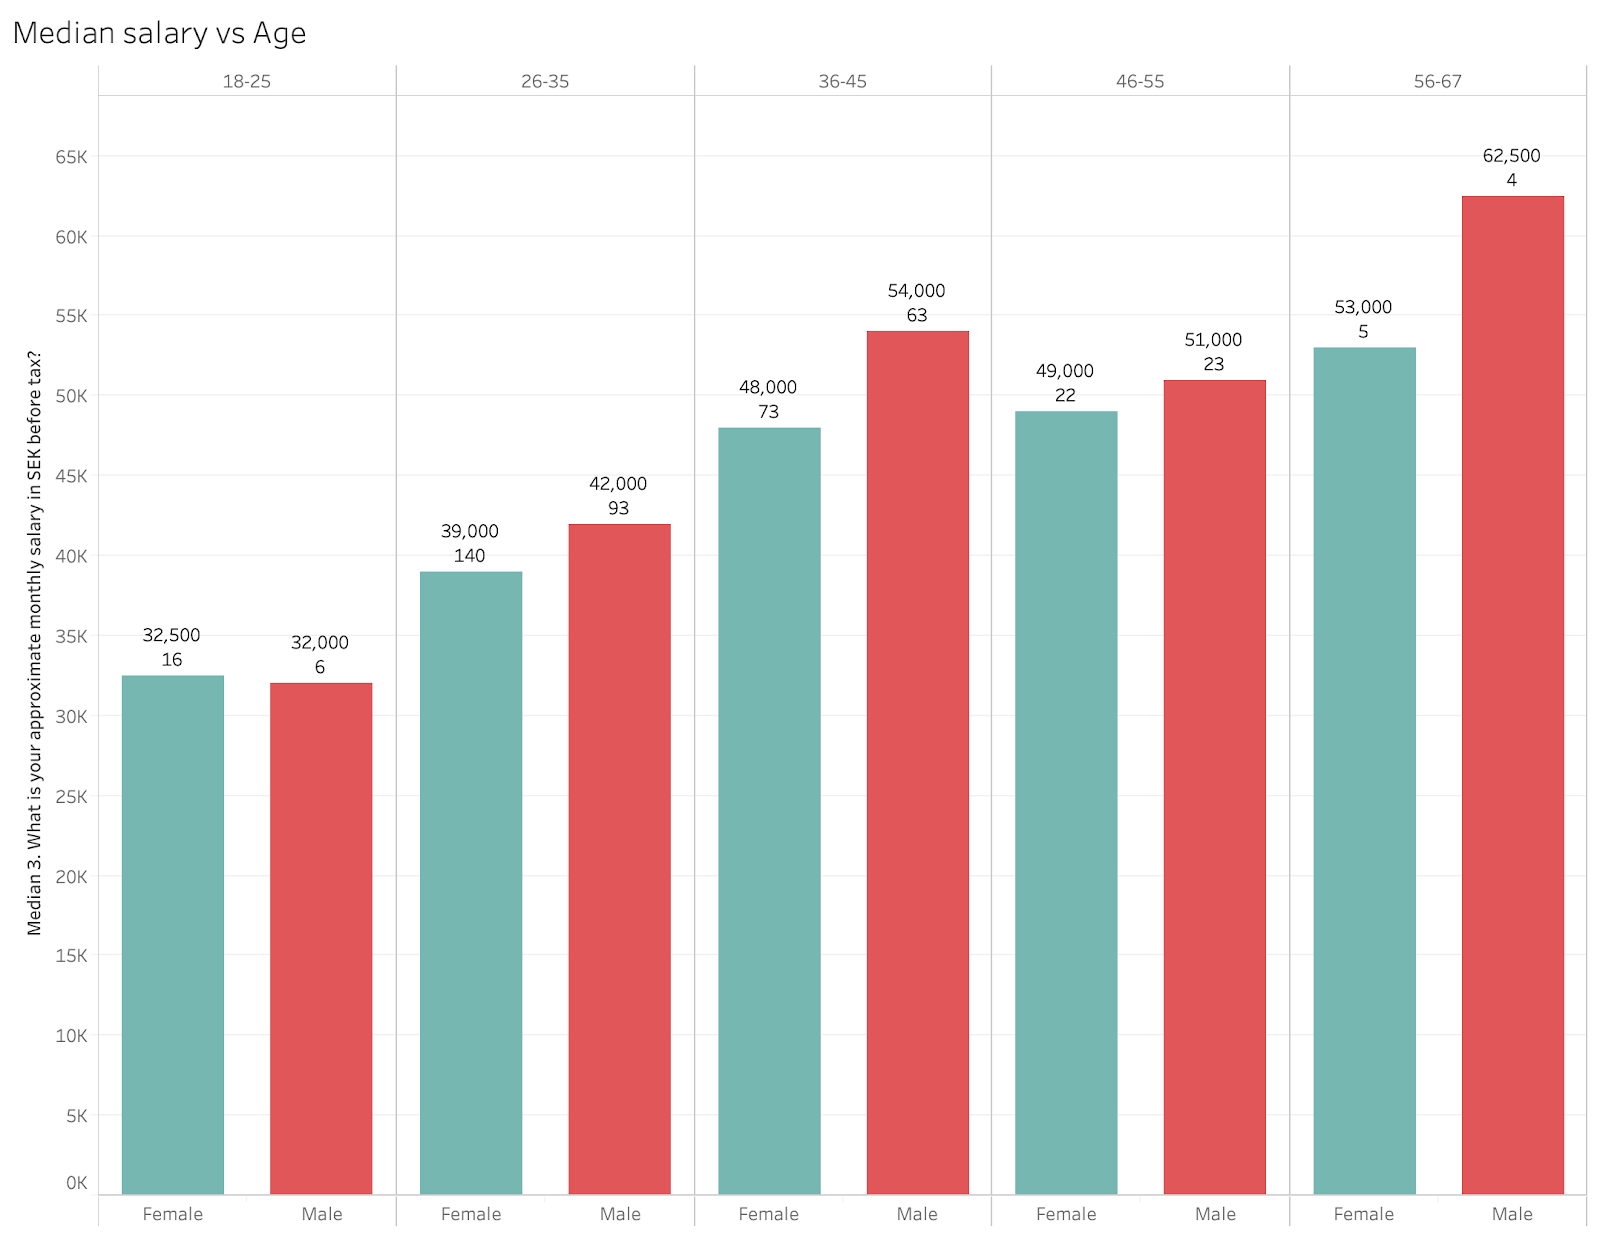
Median salary vs life experience (age)
On the whole, the more experience (age) you have the higher salary you get. With peaks for men between 36-45 and 56-67 years old, which didn’t exist last year.
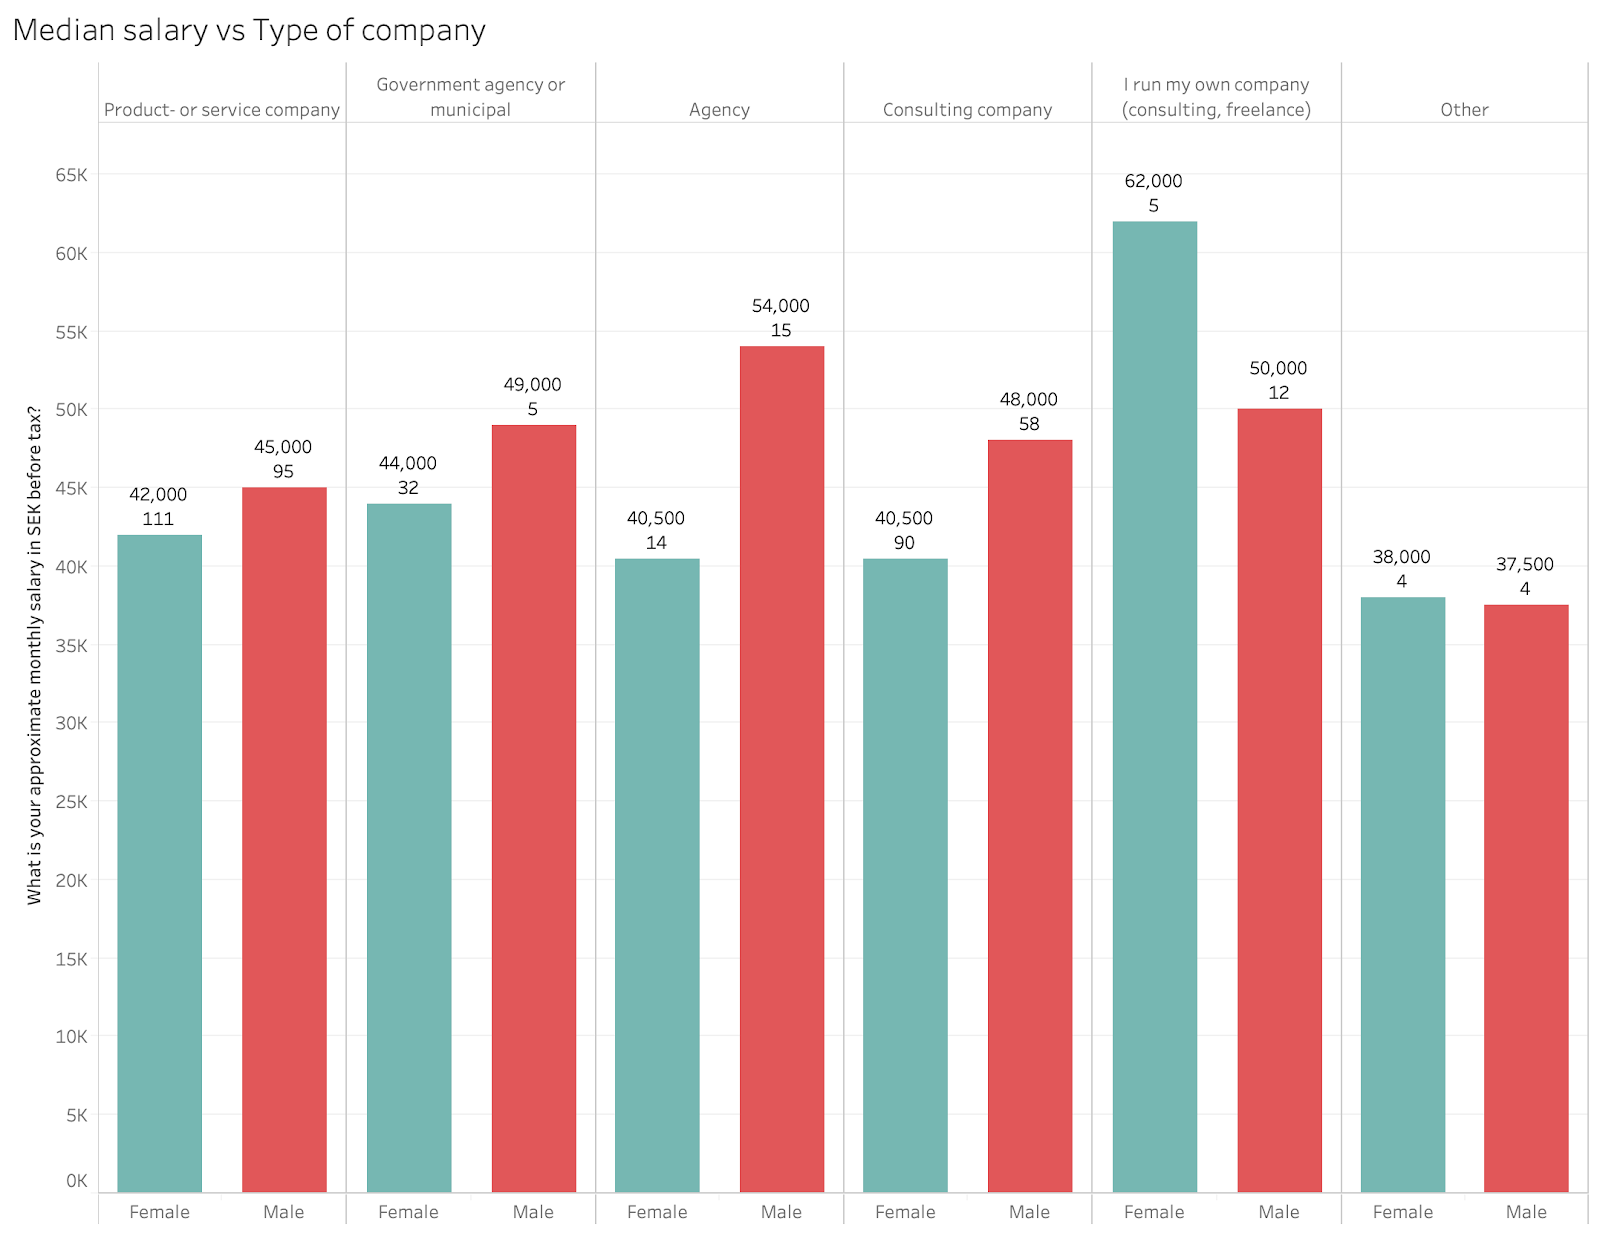
Median salary vs type of company
Here are the numbers for different types of companies and organizations. The biggest differences between gender are at agencies and own companies. They also have increased their salary levels compared to last year. So the trend from last year, that consulting companies + agencies have increased their salary compared to product companies, is continuing.
But, an important aspect for the analysis is the low amount of answers in “I run my own business”. Also note that when running own companies the salary can be based on salary and divident.
Median salary vs size of company
In general, the larger the organization is the better salary you get. But this year we see an increase for smaller companies, especially single workers (which probably are people who run their own consultant company).

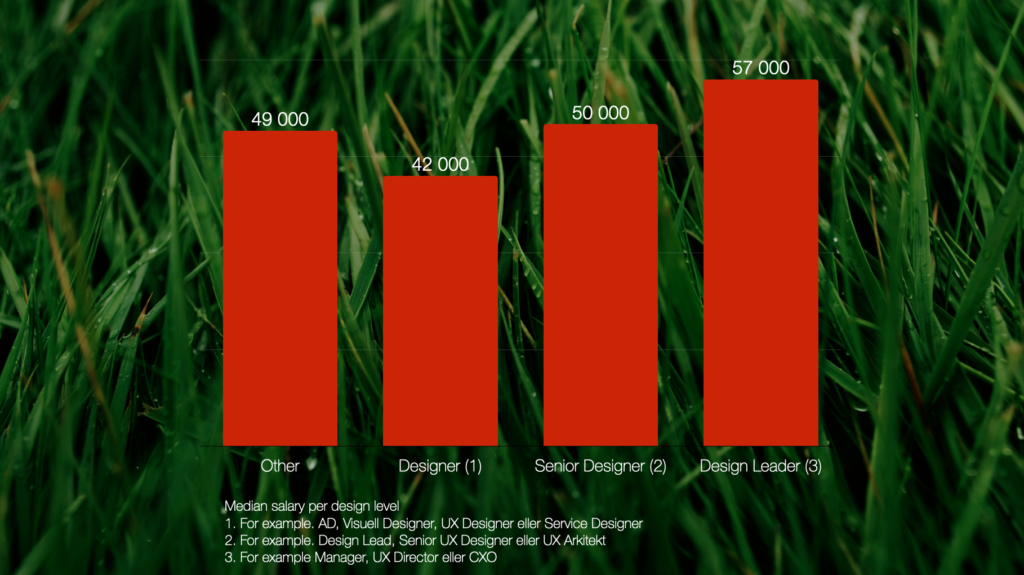
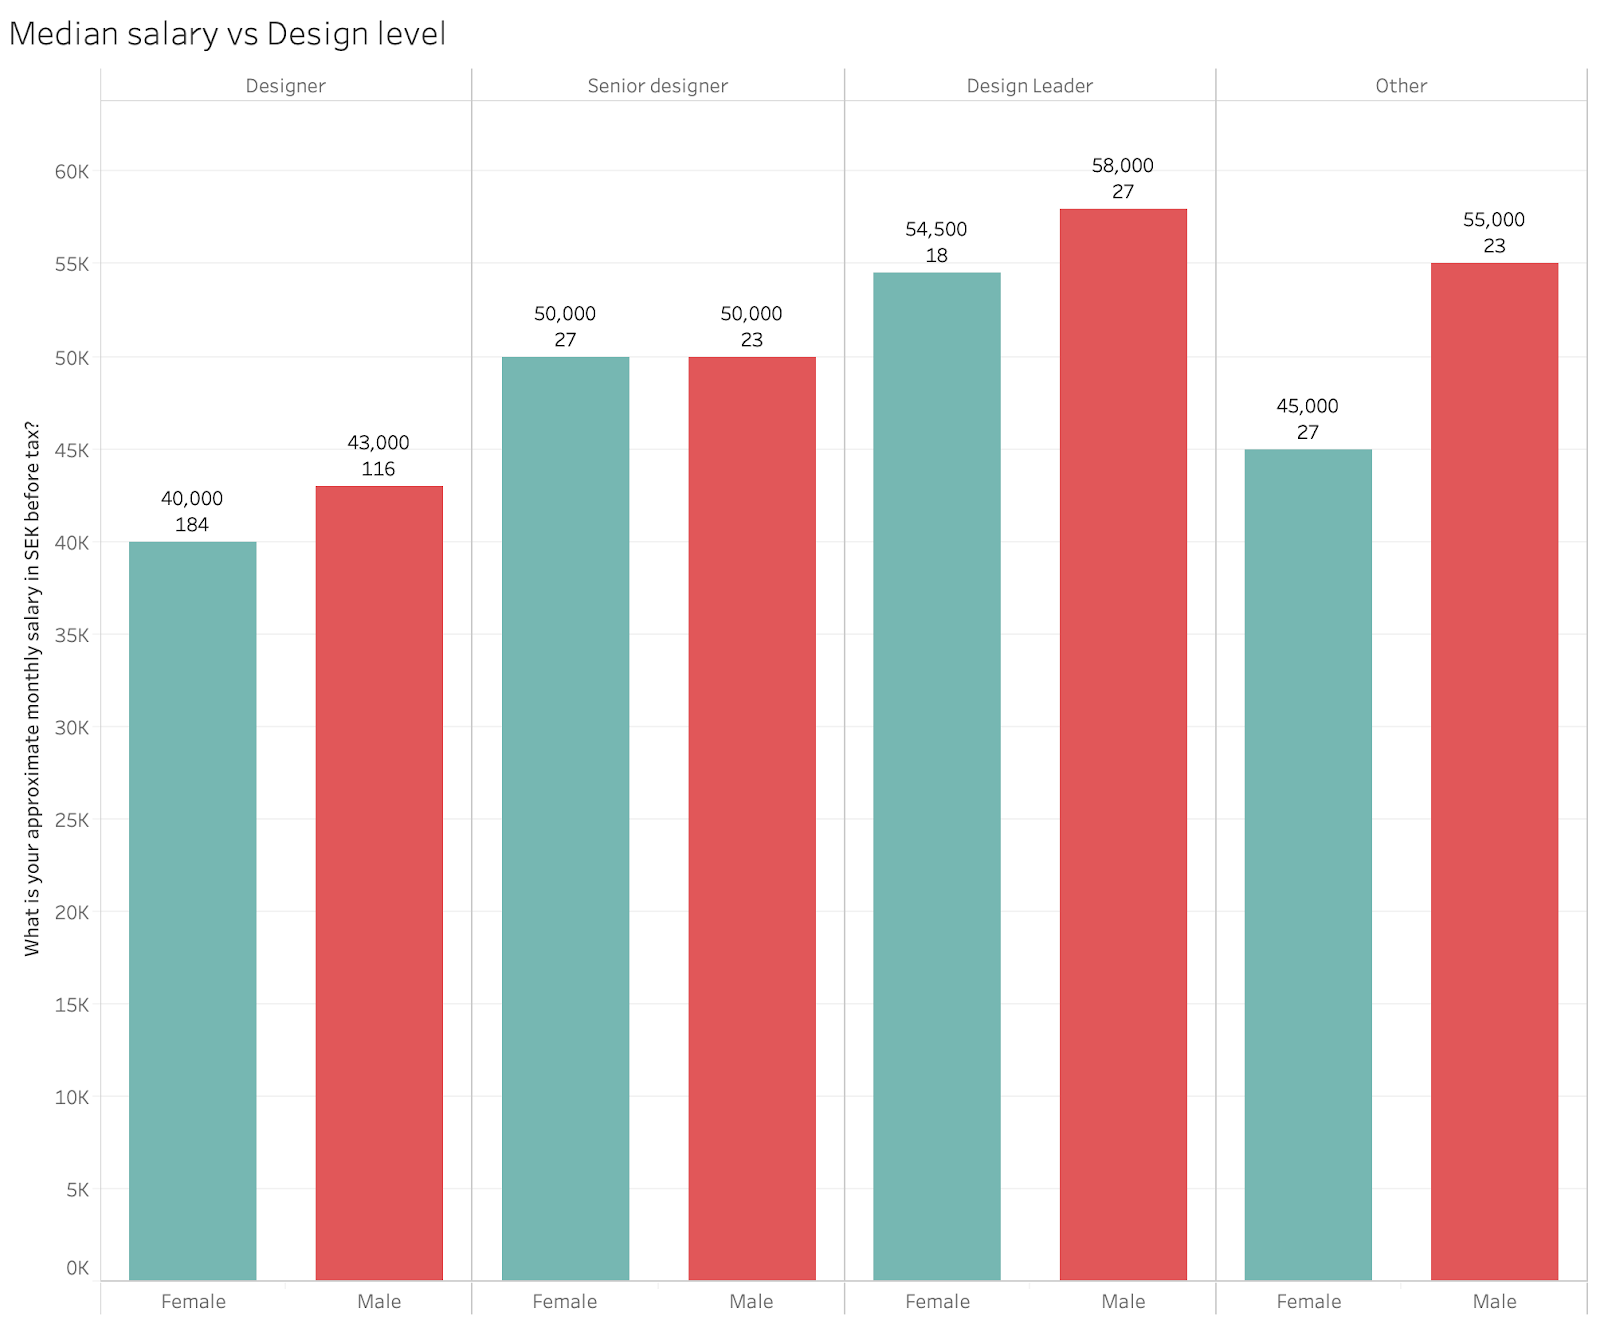
Median salary vs design level
We have grouped different titles into different groups. To not make it too complicated we created four different groups, Other, Designer, Senior Designer, Design Leader and manager. This one kind of hard as there are no good rules on what makes you a senior. You can see a difference between working as a designer or design leader.
- Designer: UX Designer, Service Designer, Visual Designer & AD etc.
- Senior Designer: UX Lead, UX Architect etc.
- Design Leader and manager: Manager, CXO, Head of Design, Design Director etc.
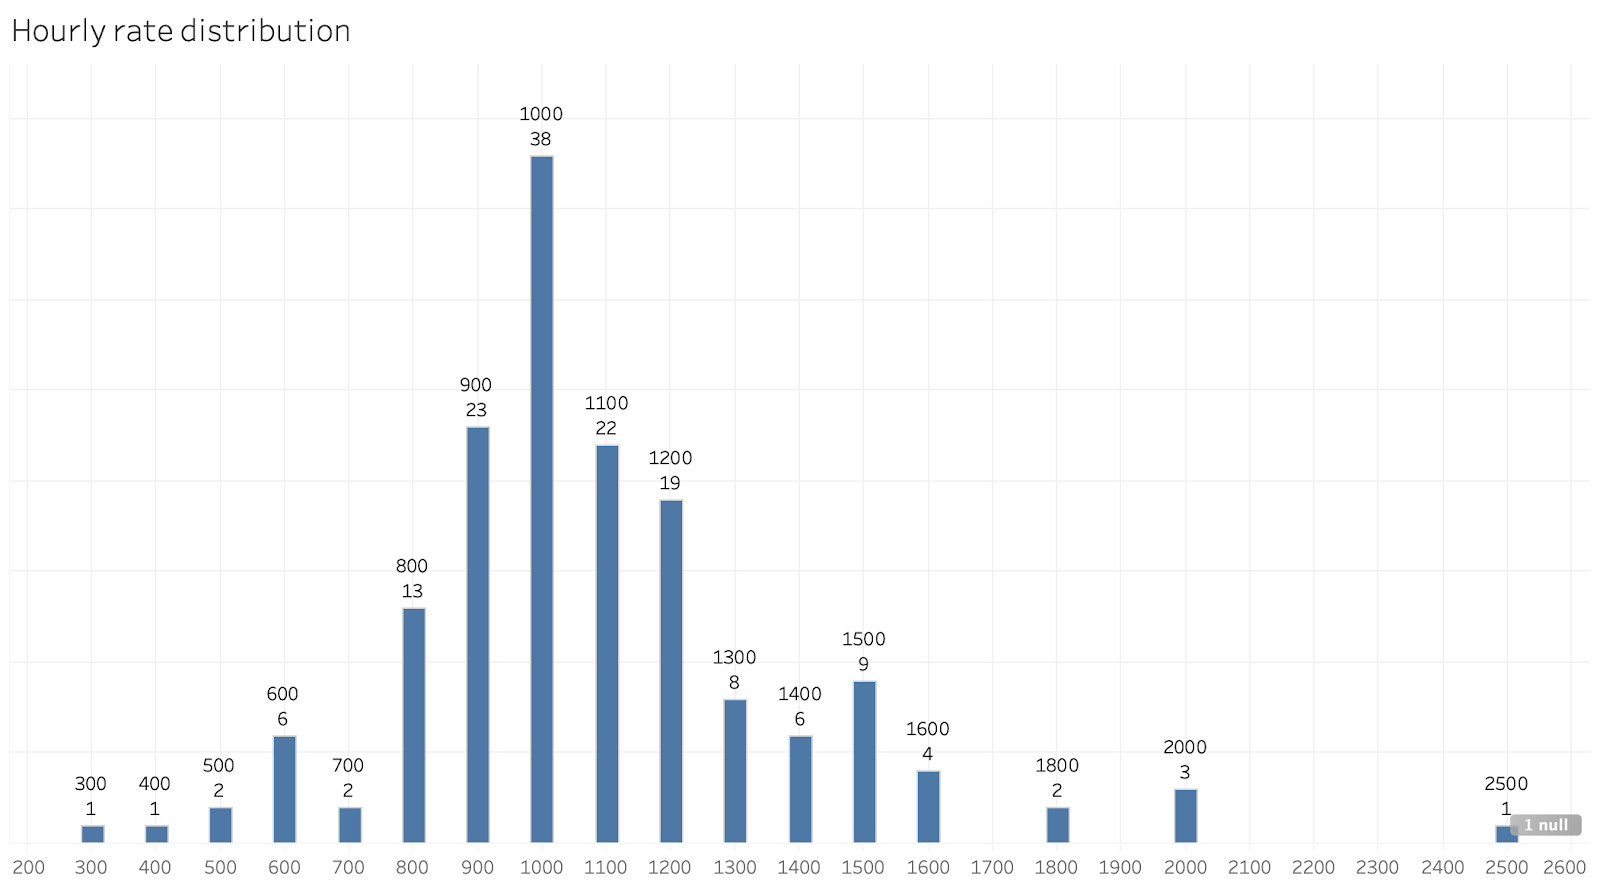
Median hourly rate as consultant or working in an agency
Consultants or freelancers often have an hourly rate (excluding tax means that the price does not include VAT). There is still a wide range in the price, from 300(!) to 2500(!) with an average of 1.000 excl. tax (down from 1.100 last year).
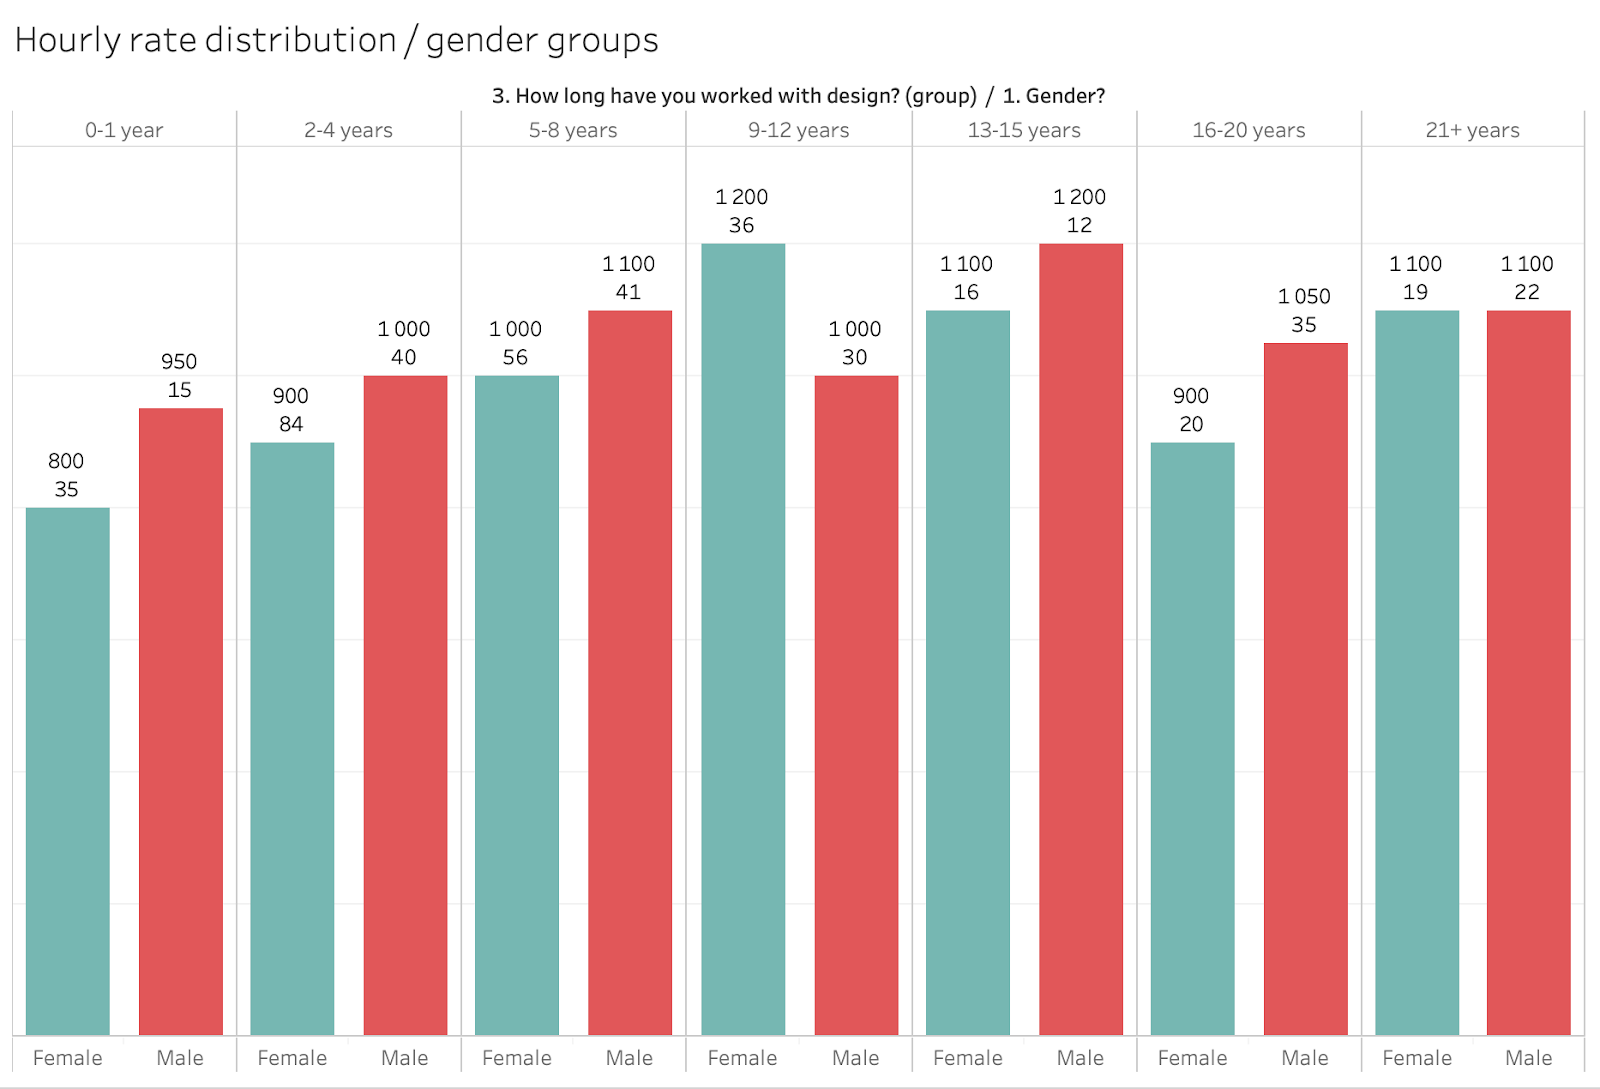
The hourly rate goes from 800-1200 in median per design experience groups.
Our take: The price should reflect the experience, we would say.
How many hours is a normal workweek stated in your contract?
A normal work week in Sweden is 40 hours which shows in the numbers. Nice to see that some work less.

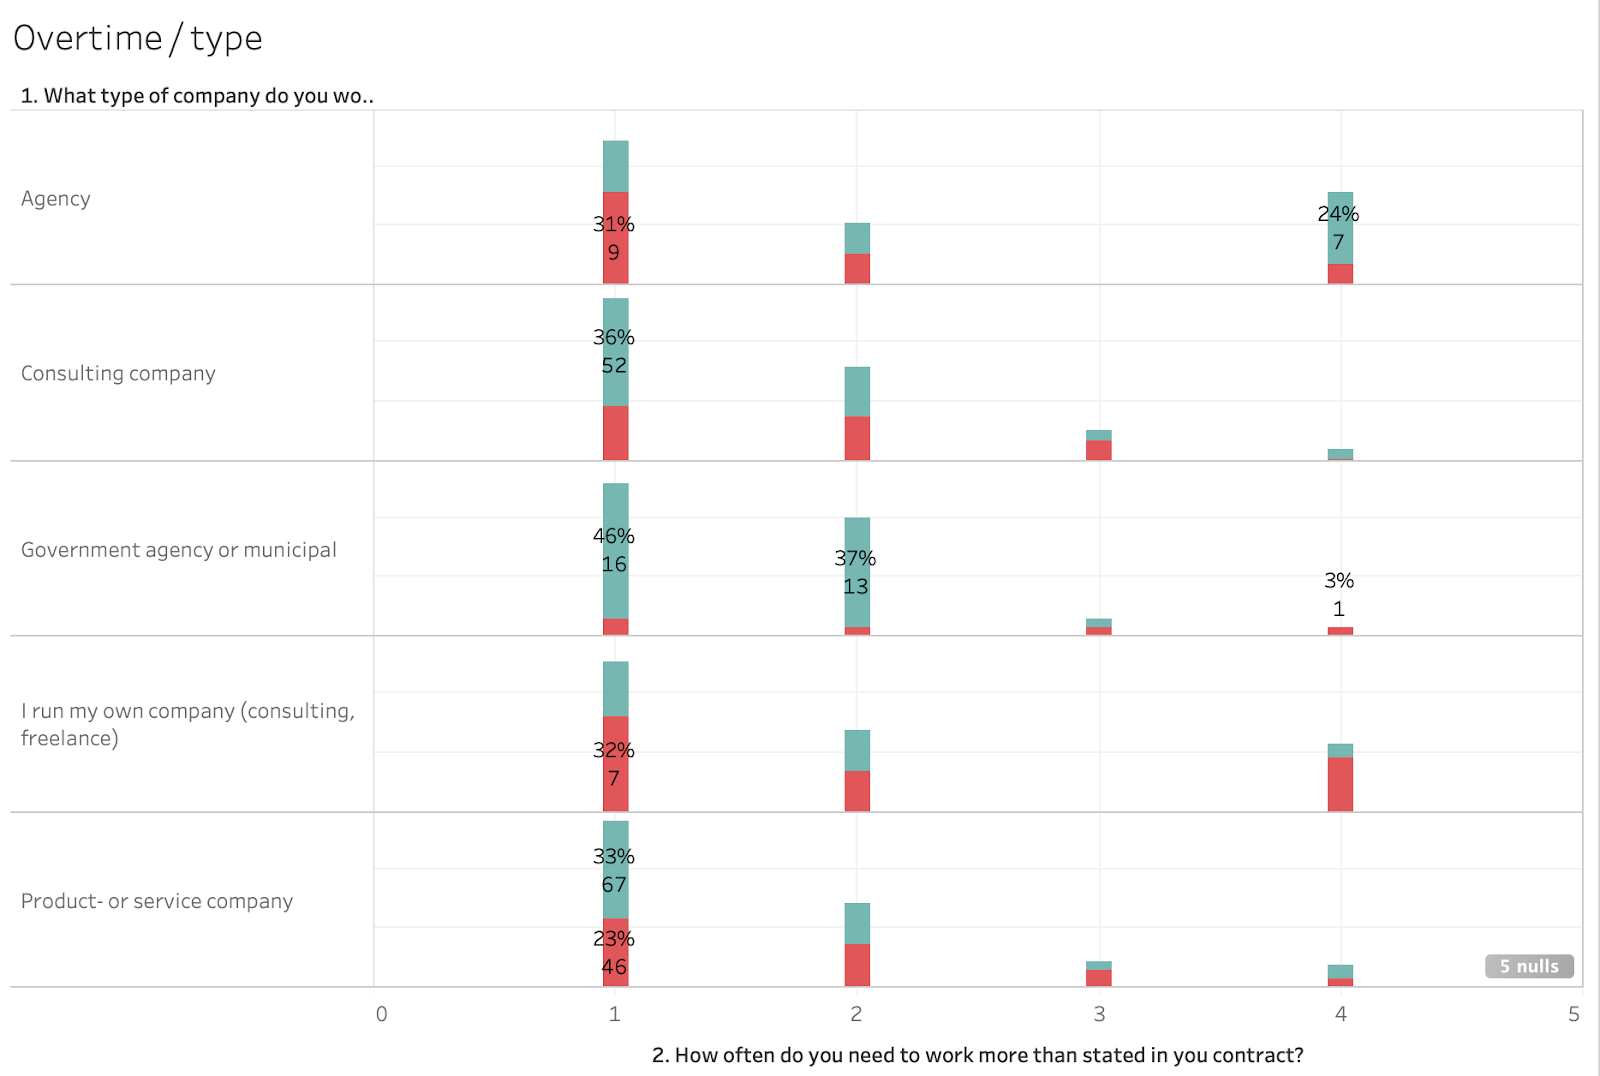
How often do you need to work more than stated in your contract?
54% never work overtime but 46% do. If we compare gender, 42% of females and 51% of males work overtime. We can also see that designers working at agencies and as own freelancers work more overtime than others.
Over take: It’s terrible that 46% of designers work overtime. We can also see that people working at agencies and their own company often are working overtime. The respondents can answer 1-4 where 1 is never and 4 is often.

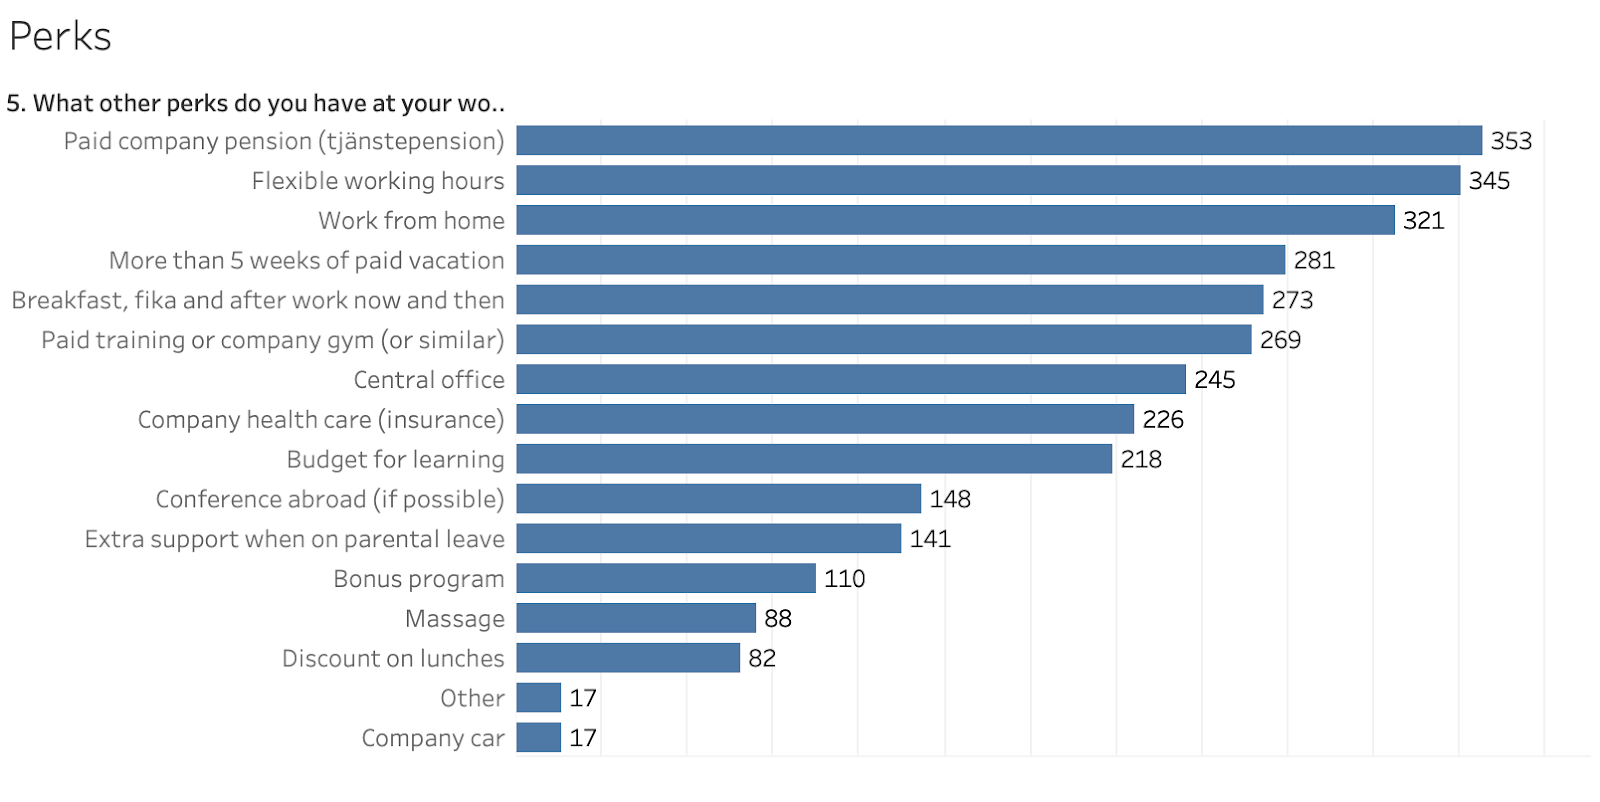
What other perks do you have at your job?
Here are some of the most common perks for designers. In Sweden, most companies let you have a paid pension plan, working from home, flexible working hours and a paid 5 weeks vacation or more.
Our take: We would say that working as a designer in Sweden is quite nice from this point of view. The perks are quite different from other countries.
Who answered this years summary?
You can find more about who answered this year’s survey here.
Thanks to
- To everyone who has answered, shared and liked the survey
- To everyone who helped to check and re-check the survey
- Pexels.com and all photographers for photos
- Tableau public for free data analytics
Next year
Please leave your name and email if you are interested in being part of next years survey.
Please join Design Leadership Sweden
👉🏾 The survey is now part of the non-profit community Design Leadership Sweden (please join our free community) 👈🏾
Previous years
Here are the result from 2019 (eng), 2018 (eng), 2017 (swe), 2016 (swe) & 2015 (swe).
Feedback
Please have look at the data and numbers, if you have any feedback and questions, let us know at [email protected]